
In about a month, China will start to celebrate the Year of the Tiger. For the Income Builder Portfolio, we get to celebrate the Year of Explosive Income Growth every single year.
![]()
And that’s a good thing … because given what we named this project, this had better be a portfolio that is building some serious income!
Year 4 is in the book for the IBP, so let’s get right to the data. The following table shows how much income each of our 46 positions produced in 2021 compared to the previous year:
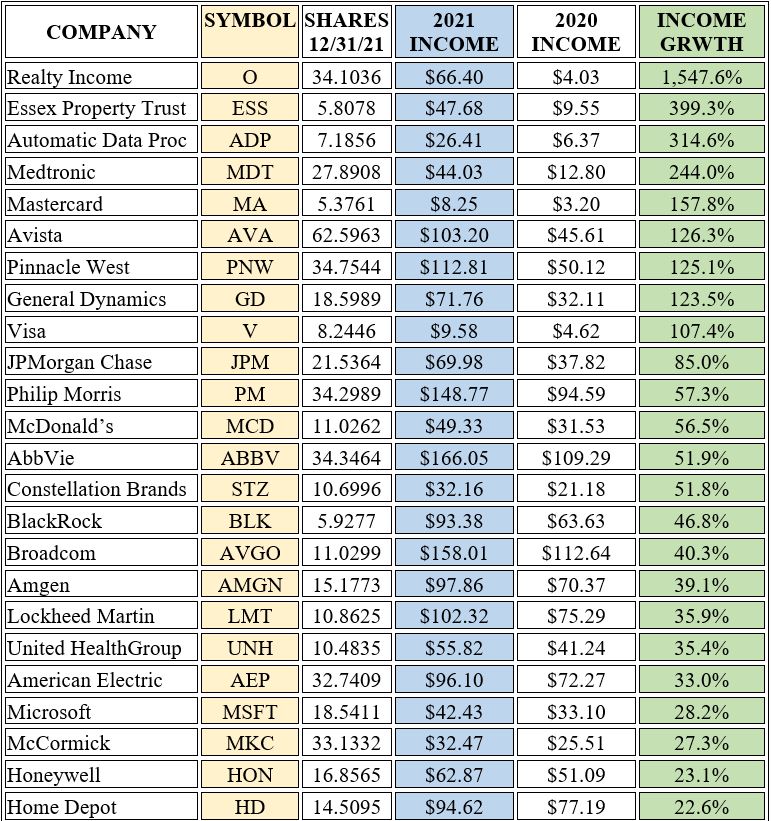
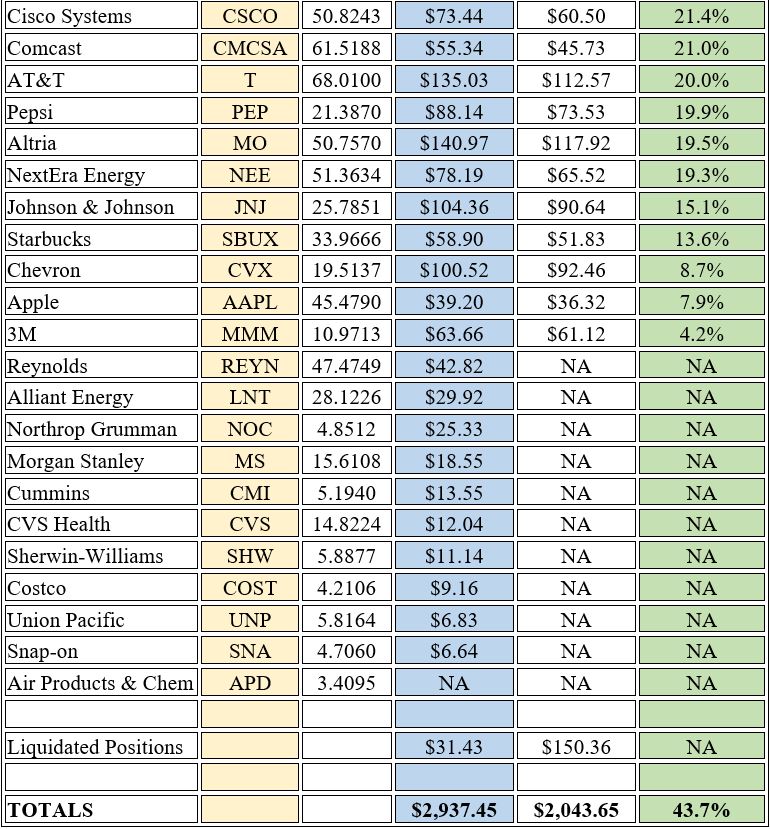
There are no typos in that table. The IBP actually produced 43.7% more income this past year than it did in 2020. (And that comes after income grew 74% in ’20 compared to 2019.)
Nine holdings generated increases of at least 100%. And one — Realty Income (O) — had a ridiculous rise in excess of 1,500%.
How is all of that possible? It’s quite simple, really:
New money is coming into the Income Builder Portfolio over and over again, and it’s constantly being invested into high-quality, dividend-growing companies.
Twice every month, this site’s co-founder, Greg Patrick, allocates $1,000 for me to invest on his behalf. That means we made about $24,000 in stock purchases in 2021, as we did in 2020, as we did in 2019, as we did in 2018. In addition, we’re all about dripping — the process of reinvesting dividends right back into the stocks from which they come.

But really … how did the moolah from the IBP’s Realty Income position grow by 1,547.6 percent?
Well, first it’s a matter of timing. Because we initiated the position on Nov. 6, 2020, when we bought 17.24 shares, we received only one $4.03 dividend last year — so the comparison point from 2020 was very low. Then the fun really began …
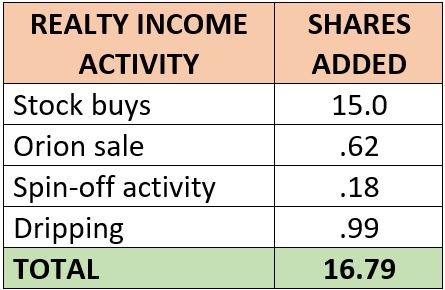
I selected O for purchase three more times since then, acquiring 15 shares that way. Spin-off activity in November resulted in the IBP receiving 2 shares of Orion Office REIT (ONL); I sold that and used the proceeds to add .62 of a share. The portfolio also received $13 in cash as part of the spin, and that was turned into .18 of a share.
Along the way, Realty Income lifted its dividend 5 times: four 0.2% increases and one 4.2% hike, resulting in a combined 5.1% raise.
Finally, dripping the 12 dividend payments we got during the year from the self-described “Monthly Dividend Company” brought in another .99 of a share to the IBP.
So over the course of 2021, we added almost 17 shares of Realty Income, and the end result was $66.40 of income coming into the portfolio — 1,547.6% more than the $4.03 of 2020.

Although what happened with Realty Income perfectly exemplifies all the ways a Dividend Growth Investing practitioner can build a company’s share total and income stream, it’s obviously an extreme example. Our O position will contribute nicely again in 2022, but because the comparison point will be the $66.40 from 2021, income growth won’t be in the same universe as 1,500%.
A more typical example would be American Electric Power (AEP). Our stake in the utility was built through one buy in 2018 and two in 2020; after generating $72.27 in income in 2020, it produced $96.10 in 2021 — a robust 33% income gain.
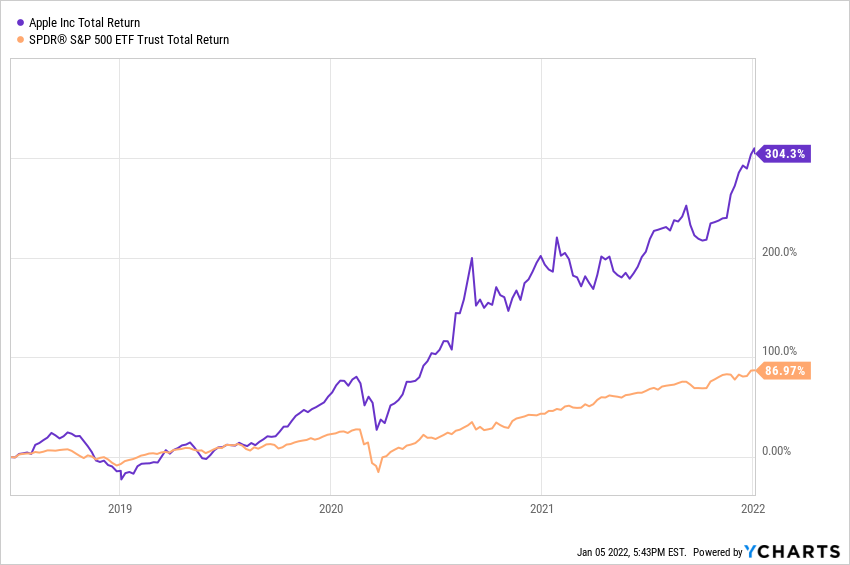
One of the smaller increases was turned in by Apple (AAPL). We’ve only made two buys of the iconic technology giant, both in 2018 at a total cost of about $2,000. Apple’s a very low-yielding company that hasn’t given investors major dividend hikes, so the position’s income only rose by 8% in 2021.
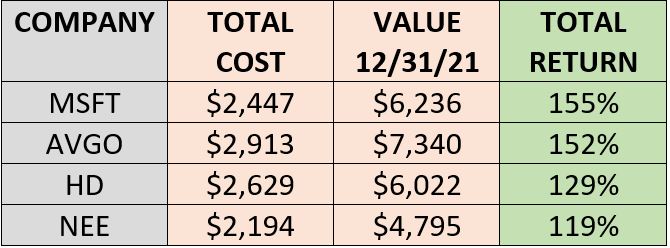
Then again … our AAPL position has delivered total return of about 300% — more than triple the S&P 500 Index’s return over the same span — so we’ll forgive the relatively small level of income growth.
Other IBP positions that produced triple-digit-percentage total returns during the portfolio’s first 4 years of existence: Microsoft (MSFT), Broadcom (AVGO), Home Depot (HD), and NextEra Energy (NEE).
At the end of 2021, the 46 positions in the IBP were worth a combined $142,881. That’s 53% more than the total at the end of 2020, but it’s important to remember that about $24,000 worth of investments were added into the portfolio during the course of the year.
Depending upon one’s goals, total return might matter most to an investor, or it might not be that big of a deal. For many investors who use the DGI strategy, total return is well down the list of what’s important.
As for this project, here is the goal as stated in the IBP Business Plan:
Build a reliable, growing income stream by making regular investments in high-quality companies, most of which have a track record of paying and increasing dividends.
The secondary goal is to build a portfolio that will experience solid total return.
So yes, it’s called the Income Builder Portfolio for a reason — income growth is the focus. Toward that end, here is some more income-related data:
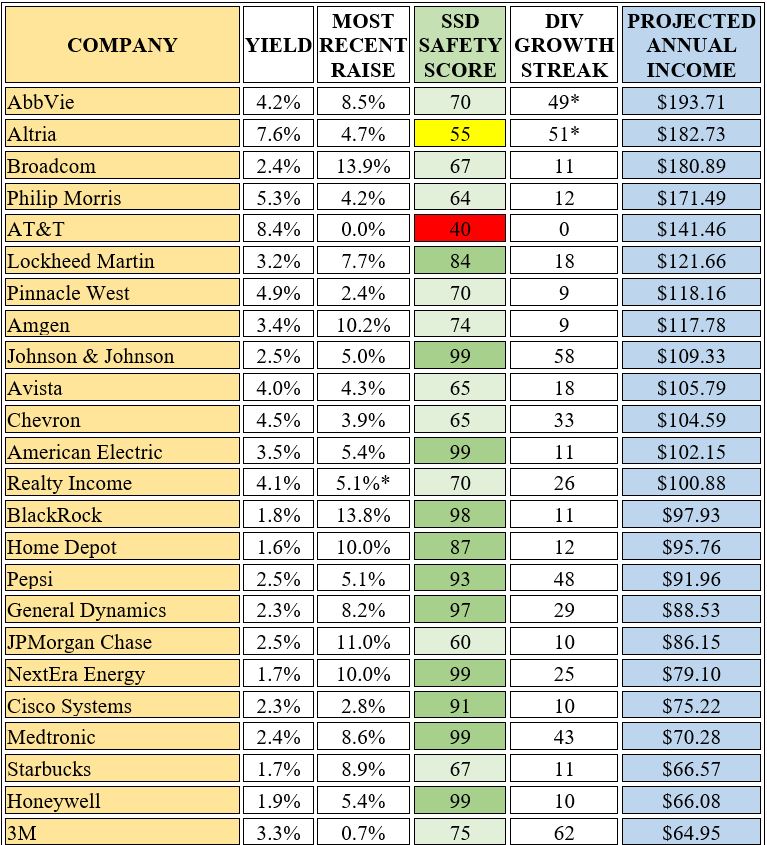
Yield and projected annual income were as of Dec. 31, 2021. The most recent raise is in accordance with what each company declared during last year. Realty Income and Union Pacific (UNP) announced more than one hike during the year; the percentage listed for each is the total increase from 2020 to 2021.
The portfolio’s two largest income-producers, AbbVie (ABBV) and Altria (MO), haven’t been stand-alone companies for all that long. But each is credited with having about a half-century-long dividend growth streak thanks to the legacies of Abbott Labs and Philip Morris, respectively.
Dividend growth streaks and dividend safety scores were provided by Simply Safe Dividends. SSD bases safety on a scale from 1-to-100 as follows:
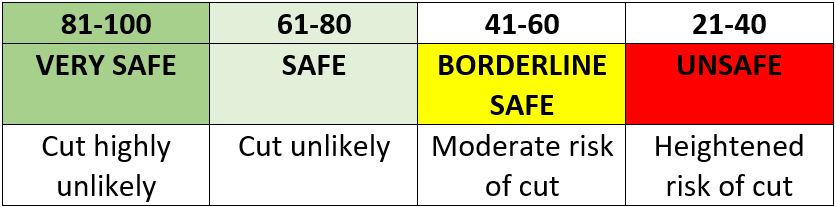
Because dividend safety is so important to me, I put my own twist on the color-coding. Simply Safe Dividends uses red for the Very Unsafe column … but I actually eliminated that column totally because I won’t put any such companies in this portfolio. For me, the 21-40 range gets the red warning.
The one “Unsafe” company we own, AT&T (T), was considered safe when we bought it. But because T is involved in corporate activity that is expected to result in a dividend reduction later this year, SSD downgraded the company to Unsafe. I have not yet decided if I will sell the stock at some point in 2022.
Morgan Stanley (MS), which like other major U.S. banks was not allowed to increase its dividend during the first year of the COVID-19 pandemic, doubled its payout during 2021 — a move that helped convince me to initiate a position within the Income Builder Portfolio.
Visa (V), which only raised its dividend 7% in 2020 after several years of significant growth, was back to its aggressive ways with a 17.2% hike.
Heating back up after having frozen its dividend since 2017, CVS Health (CVS) came through with a 10% raise.
NextEra Energy made its sixth consecutive double-digit-percentage increase, unusually strong dividend growth for a utility.
Union Pacific raised its dividend 10.3% last spring … and then the railroad decided that was so much fun that it hiked the payout 10.3% again in December.
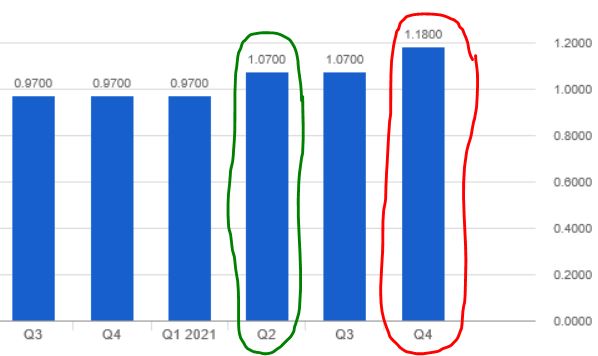
Union Pacific dividend payments. (fidelity.com)
None of the 46 IBP stocks cut its dividend in 2021, and AT&T was the only component to freeze its dividend. Nevertheless, due to a depressed share price for most of the year, T ended the year as the portfolio’s highest yielder at 8.4%.
On Target … And Then Some
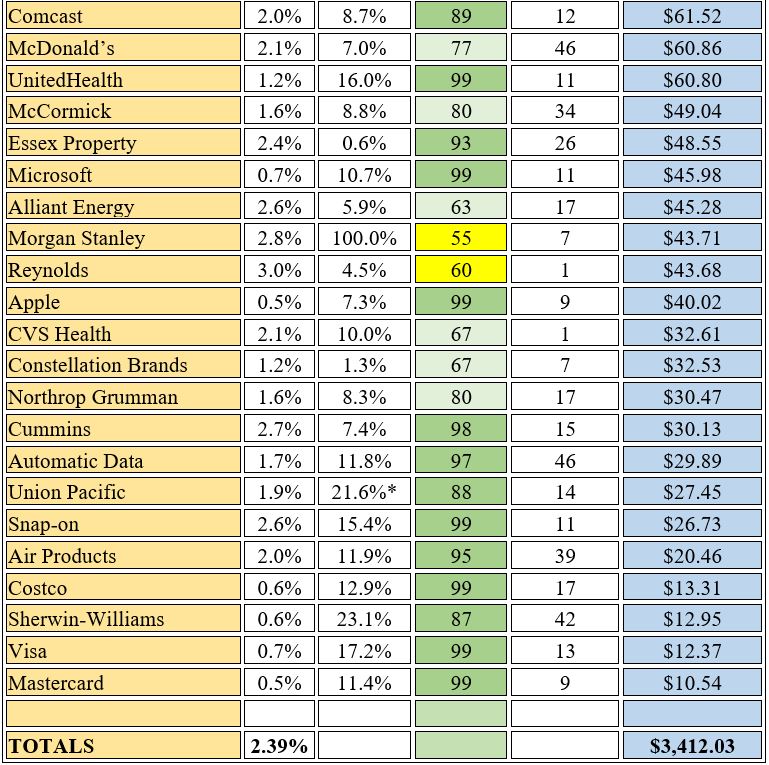
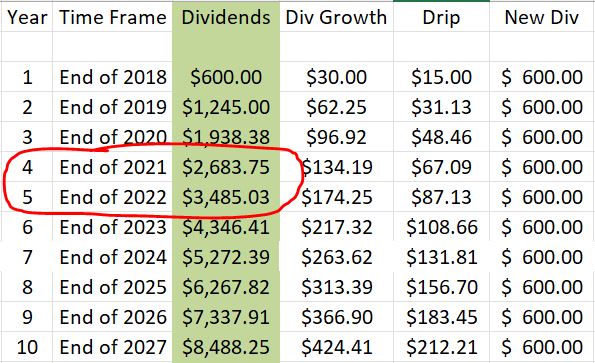
When we first decided to undertake this project, we came up with an Income Target: at least $5,000 in annual dividends within 7 years of the portfolio’s inception.
Using the assumptions of a 2.5% yield and 5% annual dividend growth, the projected income stream after 4 years was $2,684. In actuality, the IBP hit $3,412 at the end of 2021 — only $73 shy of the projection through FIVE years.
Wrapping Things Up
It’s nice to be so far ahead of the target pace we established back when this all began 4 years ago … but what’s even nicer, in my mind, is that we’ve gotten there without “reaching for yield.”
Sure, the Income Builder Portfolio has a few high-yielders, but we also own 19 companies yielding 2% or lower — including a half-dozen under 1%. Thanks to strong price appreciation, the overall portfolio yield was only 2.39% at the end of 2021.
For many DGI practitioners who need or want significant income, 2.39% won’t cut it — and that’s just fine. The idea of this endeavor never was to convince fellow investors to replicate the IBP. We’re all about discussing the process of portfolio building and presenting interesting companies for further research.
A wealth of information about the Income Builder Portfolio, including links to every IBP-related article I’ve written, can be found HERE.
I also manage another real-money project for this site, the Growth & Income Portfolio. See the home page HERE.
In addition, I regularly do videos for our Dividends And Income Channel on YouTube. Check out my latest HERE.
Happy investing in 2022, everybody!
— Mike Nadel
The goal? To build a reliable, growing income stream by making regular investments in high-quality dividend-paying companies. Click here to access our Income Builder Portfolio and see what we’re buying this month.
Source: DividendsAndIncome.com