Last month, I reviewed sector performance in 2023. I wanted to get more insight into the worst-performing sectors. Here is the record, updated by a month.
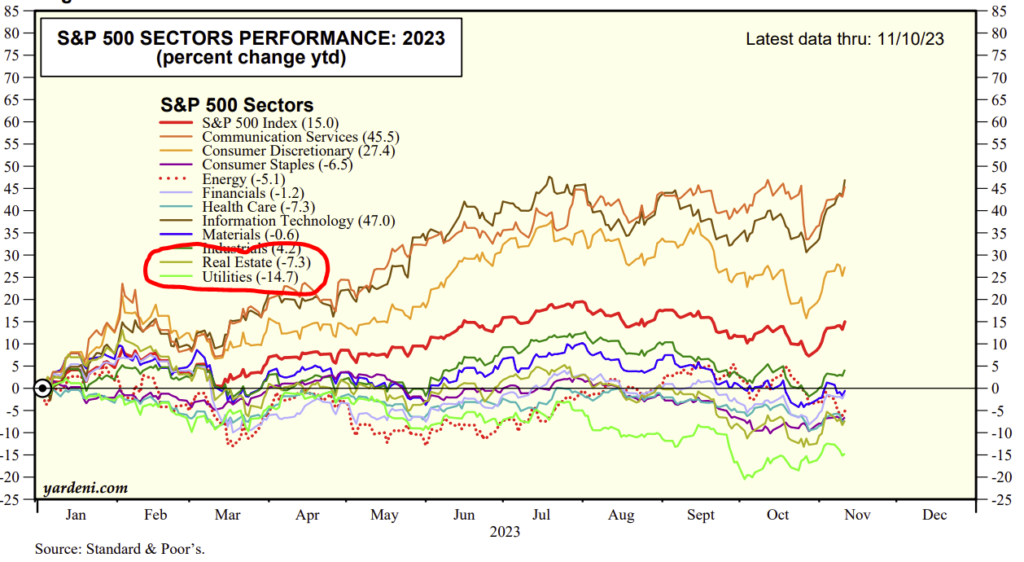 Source: Yardeni Research
The picture hasn’t changed much. The two worst-performing sectors are still Real Estate and Utilities.
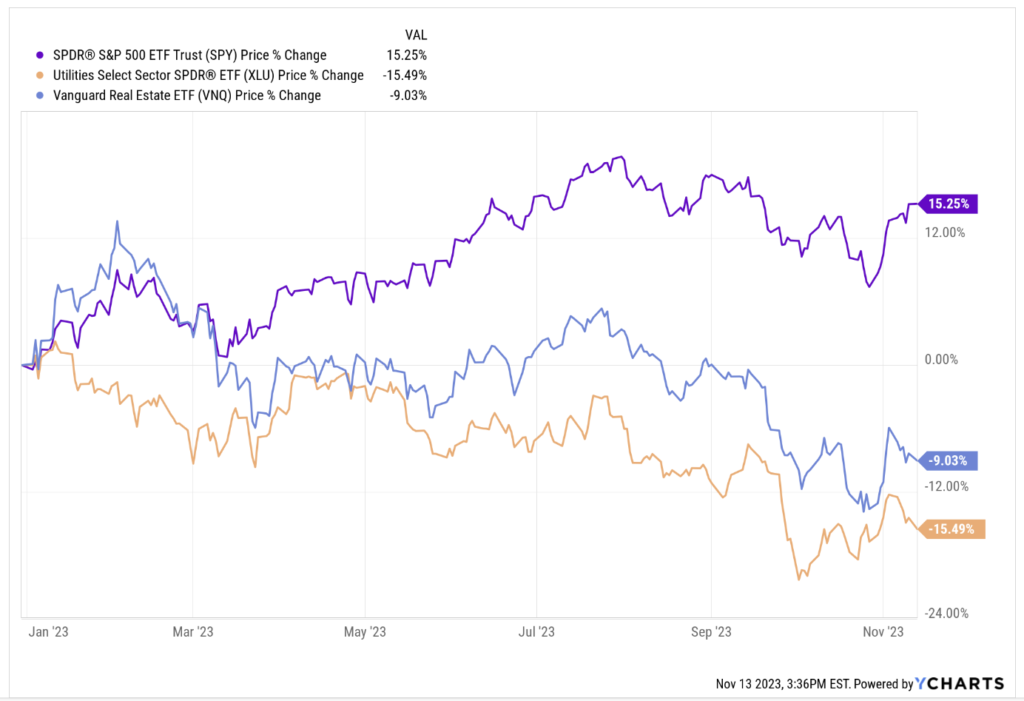
Let’s get rid of the noise in that chart and just look at the S&P 500, Real Estate, and Utilities. Here’s what we find, as shown in the chart below:
- SPY, SPDR’s ETF for the S&P 500 – common benchmark for the market: +15% this year
- VNQ, Vanguard’s Real Estate ETF – common benchmark for Real Estate sector: -9%
- XLU, SPDR’s ETF for Utilities – common benchmark for Utilities sector: -15%
 Why am I interested in the worst-performing sectors? Because the price drops have created some good values in Utilities and Real Estate stocks. My optimistic side tells me that these not only present good buying opportunities, but that they are also likely to rebound when interest rates stop going up.
I am not very concerned with short-term price losses, because if I do not realize them by selling, they are only on paper. I consider them to be mostly due to the steady interest rate hikes that we have seen over the past two years.
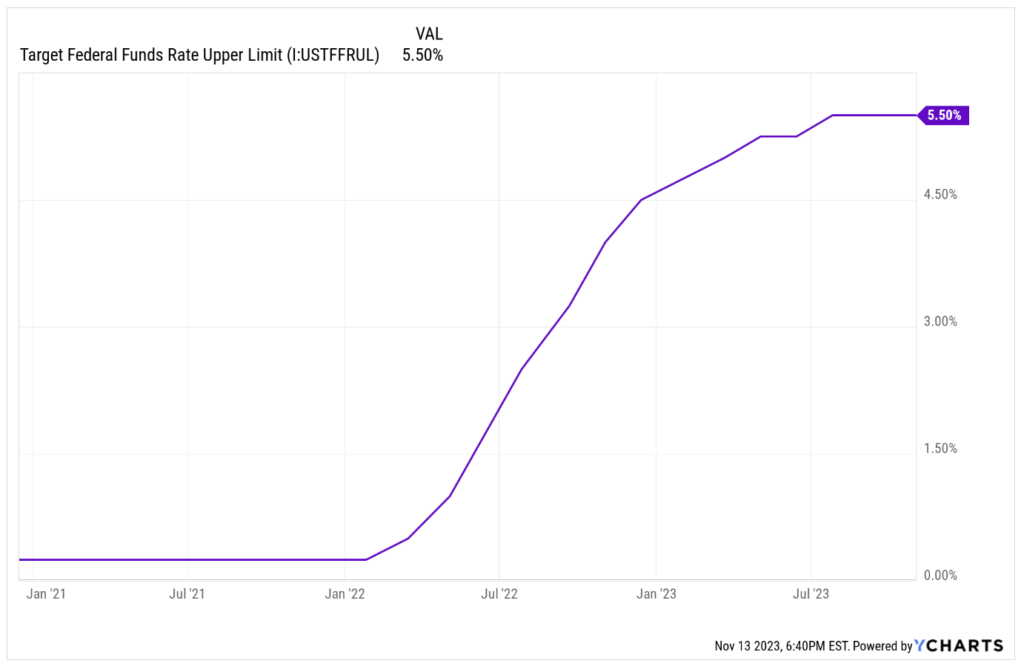
Rising interest rates affect the operations of companies in both sectors, and they also make fixed-income instruments like CDs, money market funds, and bonds more competitive investments, based on their having similar or superior yields compared to dividend stocks.
This chart shows the swift rise in interest rates that has impacted the Real Estate and Utility sectors.
 November’s Dividend Reinvestment
 November’s Dividend Reinvestment
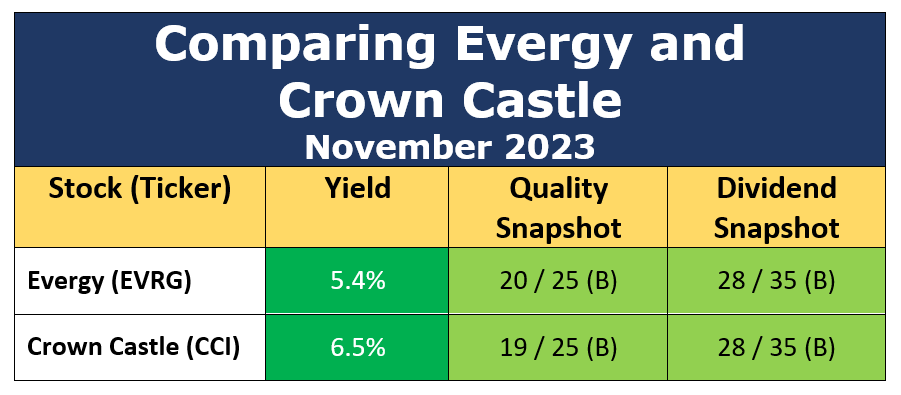
Last month, you may recall, I narrowed my dividend reinvestment candidates down to two companies, both small positions that I have been building toward 3% of my portfolio:
- Crown Castle (CCI) in the Real Estate sector
- Evergy (EVRG) in the Utilities sector
My analysis showed that they were close in qualifications, and I virtually flipped a coin to select Crown Castle. That purchase pushed Crown Castle just beyond the goal of being a 3% position.
Updating the data this month, they are still similar in qualifications. The only real changes are that Evergy’s yield rose by 0.2% and Crown Castle’s fell by 0.5%, narrowing the yield gap between the two stocks.
 Source: Author
The main cause of Evergy’s increased yield is that its 4.9% dividend increase for 2023 kicks in in December.
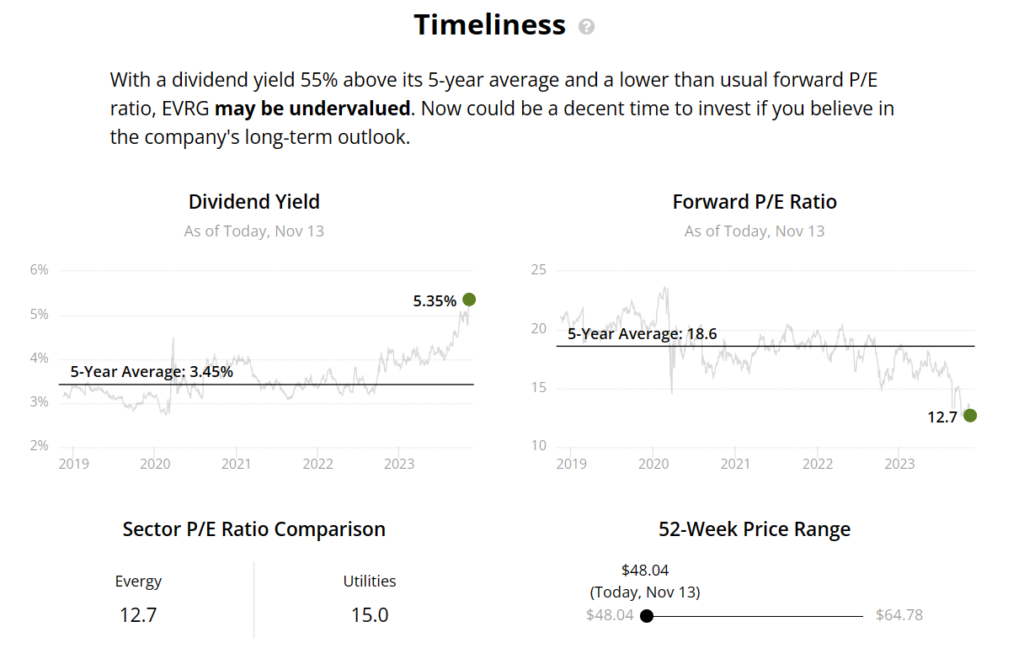
With Evergy’s price having fallen a bit, I judge its valuation now to be better than it was last month, when it was very good. Check out this graphic from Simply Safe Dividends.
 Source: Simply Safe Dividends
There are four metrics displayed, and all of them suggest favorable valuation. Reading clockwise from the top left:
- Relative yield: Evergy’s yield is a whopping 55% above its 5-year average, which is a valuation measure all by itself, known as the yield metric. The 55% gap suggests massive undervaluation.
- Forward P/E ratio. Evergy’s current forward P/E is 32% below its 5-year average.
- 52-week price: Evergy’s price is at the bottom of its 52-week range.
- P/E relative to sector: Evergy’s P/E is 15% below the sector average.
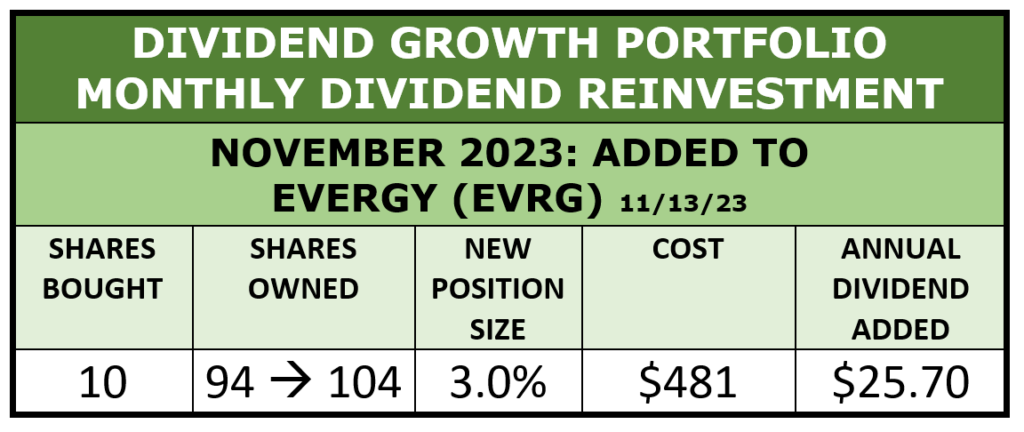
Given the favorable analysis, I reinvested my November dividends into Evergy (EVRG).
 Source: Author
I began my Evergy ownership in April, 2023. This is my fourth purchase, and it brings the position to exactly 3.0%. Thus, Evergy falls off the “small position” list.
My purchase precedes Evergy’s ex-dividend date for its December payout (which includes this year’s increase) by several days, so these new shares will receive December’s dividend.
Since all the shares of Evergy have been purchased this year, the annual income run-rate from Evergy has gone from $0 to $267 in less than 12 months. That’s sort of why I do this, in a nutshell.
If you would like to read more about the company itself, please see my April article here.
November Portfolio Review
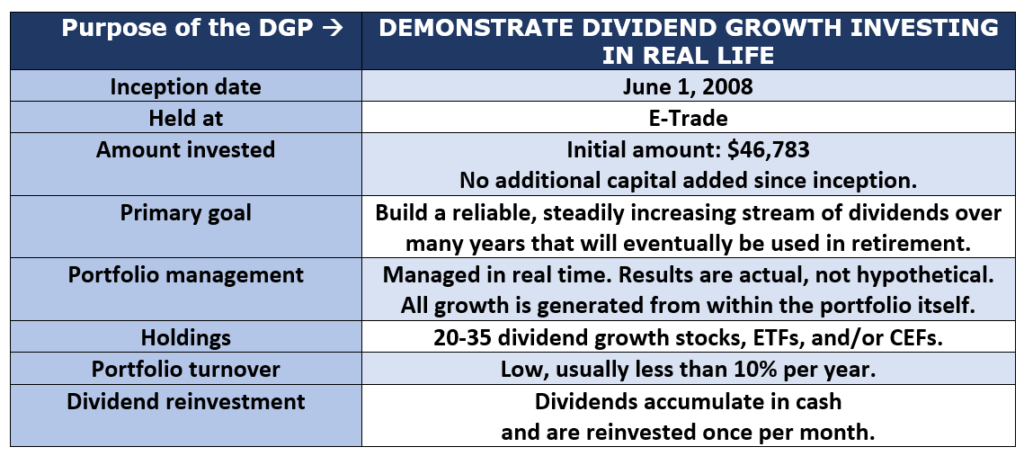
The primary purpose of the Dividend Growth Portfolio, as stated in its Business Plan, is:
Build a reliable, steadily increasing stream of dividends over many years that can eventually be used as income for retirement.
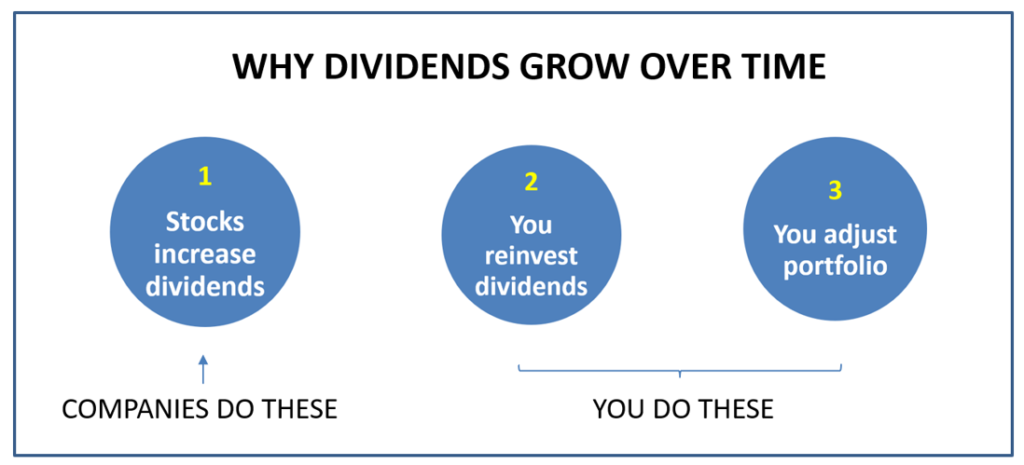
The portfolio’s dividends go up for the three reasons shown here:
 Source: Author
(1) Dividend increases
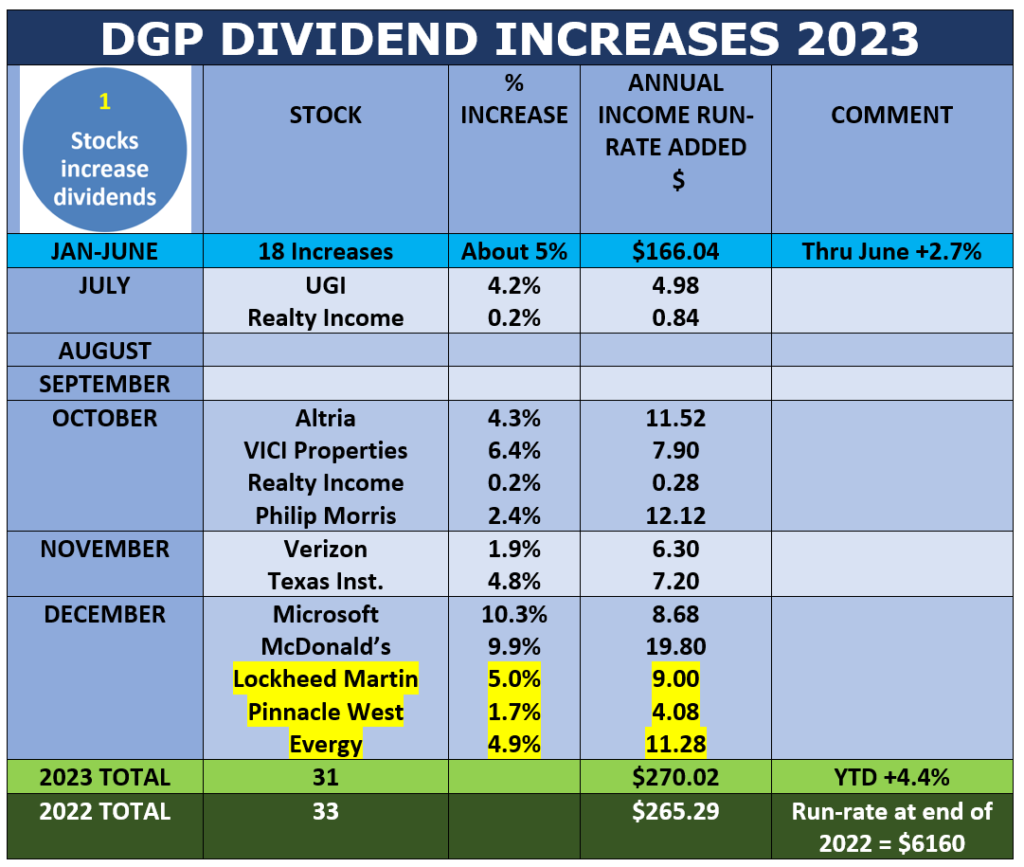
The DGP has received 31 dividend-increase announcements applicable to 2023.
On the following display, I condensed the first 6 months onto one line to save space. The highlighted entries are three new increases registered since last month, including the nice 4.9% increase from Evergy. As mentioned earlier, the new shares I just bought will participate in this increase.
 Source: Author
There is one more increase expected to impact 2023: The ETF SCHD.
With ETFs, you have to wait until the end of the year to find out whether the annual dividend was increased and by how much. That is because ETFs’ quarterly payments are variable. That distinguishes them from most dividend stocks, whose quarterly payemts are constant, then the dividend is raised, the stock pays four more at the new rate, and so on.
So far in 2023, dividend increases have added 4.4% to the portfolio’s annual dividend run-rate. Assuming SCHD increases its 2023 dividend with its December payout, this year’s dividend increases across the portfolio will end up being just a little higher (in dollars) than last year’s.
(2) Dividend reinvestments
Reinvesting dividends is the second reason the DGP’s income steadily goes up. I collect dividends in cash as they come in, then reinvest the cash each month.
Since dividends are paid per share, each additional share obtained through dividend reinvestments causes the portfolio’s income to rise.
Dividend reinvestment is literally compounding at work: I am earning more money (future dividends) on money already earned (dividends collected in the prior month).
The following table shows the DGP’s dividend reinvestment program so far this year, with the new purchase of Evergy highlighted. So far this year, I have made 11 reinvestments into five different securities.
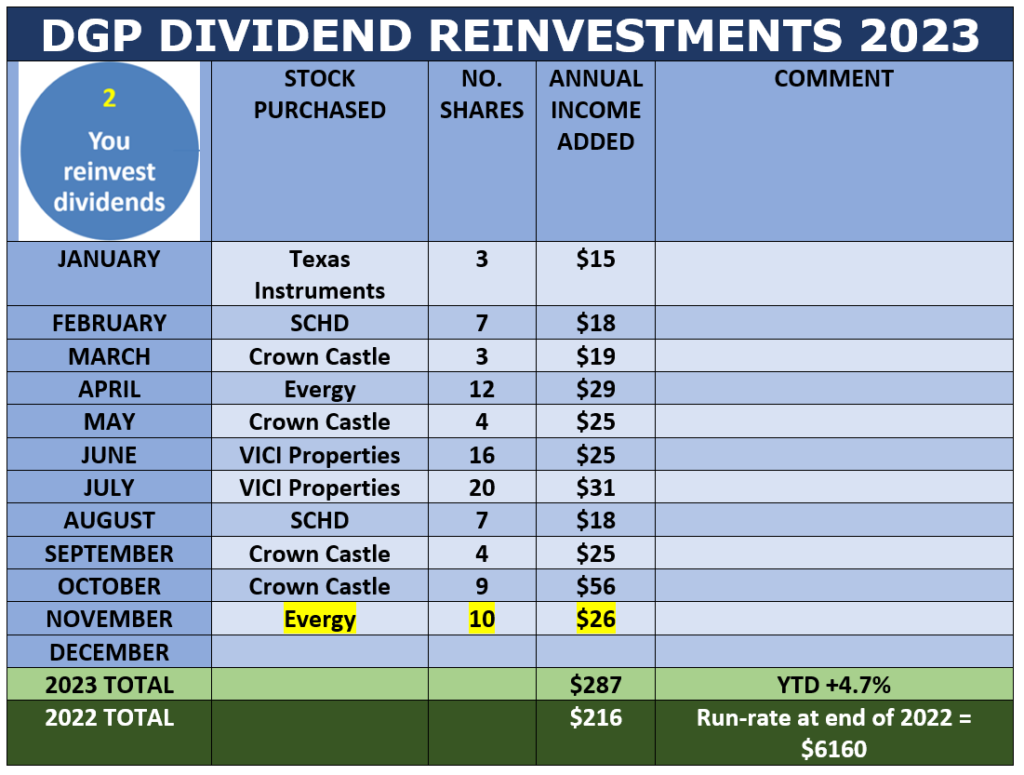 Source: Author
Note that 2023’s monthly reinvestments are increasing the portfolio’s income faster than last year’s reinvestments. That is one of the beautiful things about compounding: If you keep increasing a dollar amount by the same percentage, each step is larger (when measured in dollars) than the one before, because it is built on a larger base.
Through November, this year’s reinvestments have added $287 to the DGP’s dividend run-rate, compared to $216 for all of last year. That’s a 33% jump, and there is still one more reinvestment to come in December.
Although the slide in prices of this year’s purchases can be viewed negatively, the price drops have led to better valuations, higher yields, and more shares being purchased with each dollar reinvested. For a dividend-growth investor, those are all good outcomes.
(3) Portfolio management
The third reason that dividends go up in this portfolio is that, from time to time, I adjust the portfolio. The reasons might be to trim or sell a disappointing stock, trim a position that has become oversized, and so on.
Some individual trades and adjustments reduce the income stream for a short time, but overall, portfolio adjustments tend to increase the income stream on a long-term basis.
I made no such changes in October. During 2023 so far, I have changed about 6% of the portfolio through sales, trims, and replacements, resulting in a modest increase of $5 to the annual dividend run-rate.
Here is my watch list for possible future actions.
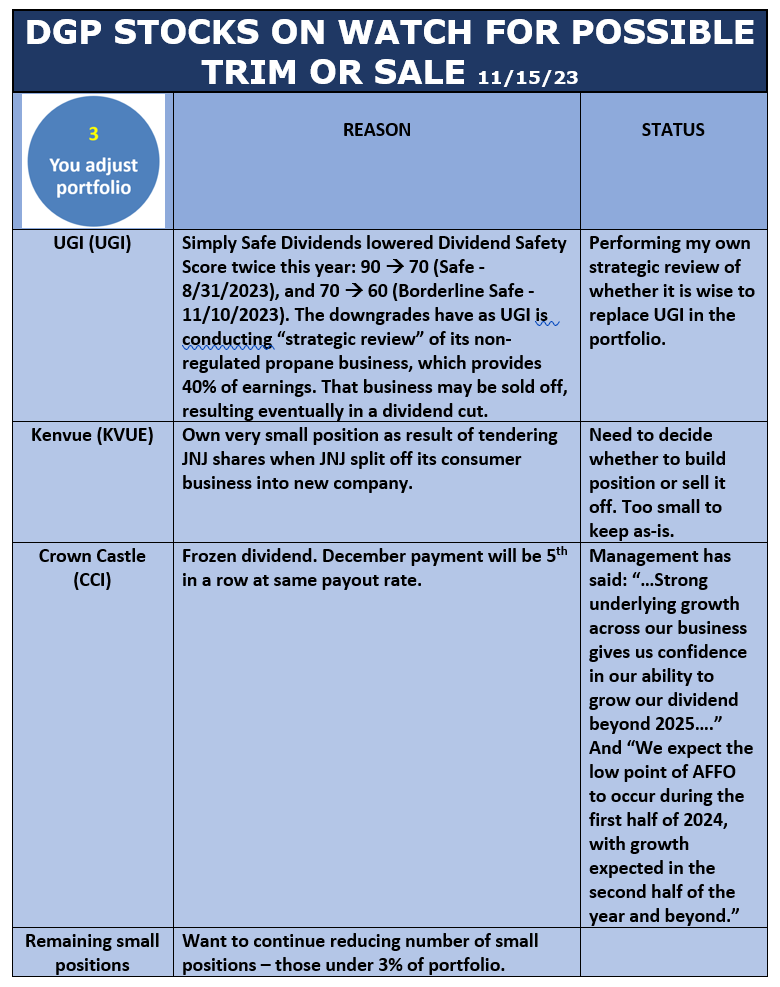 Source: Author
Small positions currently account for 28% of the portfolio. My intention is to continue to improve the portfolio by eliminating weaker small holdings and growing the stronger ones. I would like to cut the small ones to less than 20% of the DGP.
Income Growth Record
The primary goal of the DGP – to build a reliable, steadily increasing stream of dividends over the long term – has been, and continues to be, achieved, as shown here:
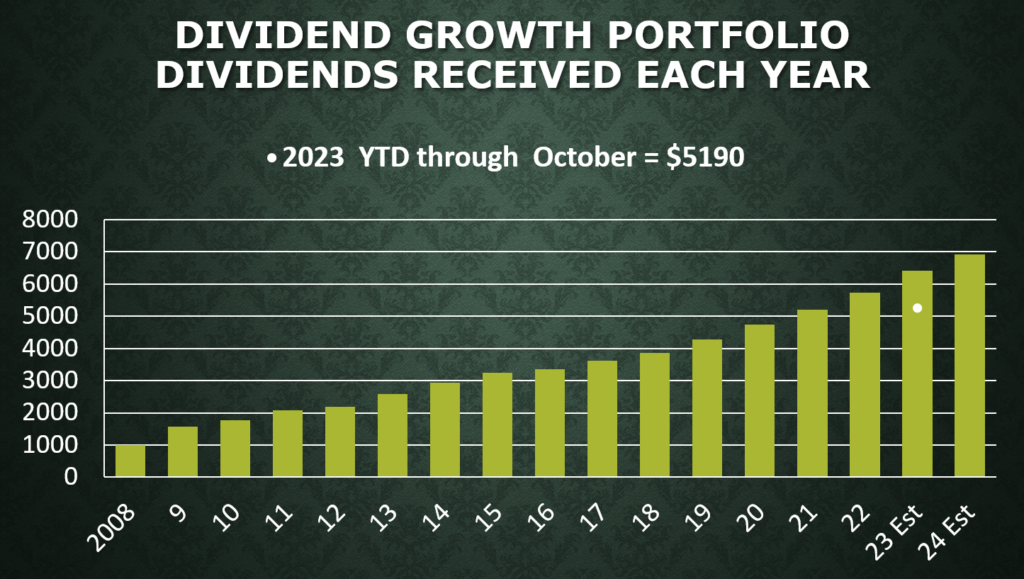 Source: Author
The full-year 2023 estimate is the sum of dividends already collected through October ($5190) plus dividends expected during the remainder of the year (at current payout rates).
Through the end of October, dividends collected in 2023 are 10.5% more than the dividends collected last year through the same time. The long-term CAGR of the annual dividends (2009-2022) has been 10.4% per year.
The 2024 estimate is simply the 2023 estimate plus 9% as a SWAG.
The full portfolio is always available here. That’s an alphabetical list, with yields, position sizes, and other common statistics.
History of the DGP
My Dividend Growth Portfolio (DGP) is now in its 16th year. The DGP is real, meaning that it is not a hypothetical, a “model,” or a back-test. All decisions about managing it have been made in real time with real money.
 Source: Author
If you want to see the full portfolio at any time, its holdings at the end of the previous month are always available here. That link also has an archive of all the articles and videos that I have published about the portfolio.
That wraps things up for this month. Thanks for reading!
-–Dave Van Knapp
Buy this small group of unique stocks... never sell them... and make all the money you need... No matter what happens in the market. Revealed here: the name and ticker of the #1 stock.
Source: Dividends & Income