To the surprise of nearly everyone, markets have been very strong so far this year. While many analysts had forecasts for a recession and another challenging year for the stock market, the S&P 500 is up 8% and Nasdaq 18% YTD.
One way to take advantage of a market that stubbornly continues to grind higher is to focus on momentum stocks. Momentum trading is the simple concept of buying the leaders, because there is a good chance that they will continue to be the leaders. It isn’t just an aphorism either, the momentum anomaly is one of the most researched and implemented trading concepts in markets, utilized by some of the biggest funds in the world.
One way to further improve your momentum trading outcomes is to focus on momentum stocks that also have high Zacks Ranks. Trading only stocks with a Zacks Rank #1 (Strong Buy), further improves your odds of buying a winner, because analysts have been upgrading earnings expectations.
To improve trading odds even further, investors can buy stocks that also have high probability chart patterns. Utilizing technical chart patterns helps traders rigorously define the entry and exit signals, keeping them out of trades that don’t look right, and getting them in trades with high risk-reward setups.
In this article I will focus on three stocks that have all three of these characteristics. Skechers (SKX) , D.R. Horton (DHI) , and Meta Platforms (META) all have strong momentum, a Zacks Rank #1 (Strong Buy), and compelling technical chart setups.
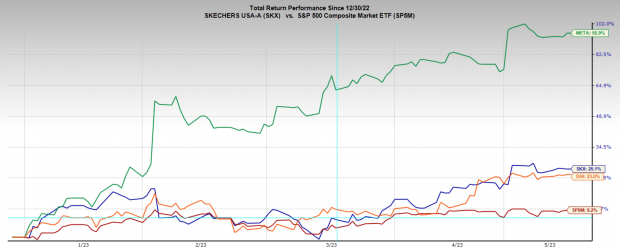 Image Source: Zacks Investment Research
Skechers
Skechers, founded in 1992, is an international designer, developer, marketer, and distributor of footwear. Skechers products are available in more than 170 countries with 4,549 stores, including 548 domestic stores, 927 international locations and 3,074 distributors, licensees, and franchise stores.
SKX stock has had a very strong start to this year, rallying 25% in the last four months. SKX has also been a high performing stock over the last decade. Over that period, it has returned 22% annually, more than 6’xing investors’ money, and handily outperforming the broad market.
However, if you look closely at the performance chart below, you will see most of those gains came in the early years of the last decade, trading mostly sideways since 2015. But, based on the current setup, SKX looks like it may be at the start of another major bull run.
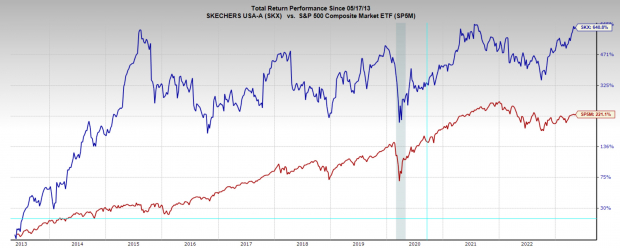 Image Source: Zacks Investment Research
In the price action chart below we see SKX had built out a solid base through the first few months of the year. When a stock bases like this, it means large investors are slowly building a position. Then at the end of April the stock broke out above $50 with a convincing gap higher, that has yet to be filled.
Now through May, SKX has built out a tight consolidation, bull flag from which we can measure a trade from. If SKX stock can trade above $53.50, it should break out higher, and make new all-time highs. Alternatively, if the stock trades below the bottom of the range, $51.70, the setup is invalidated.
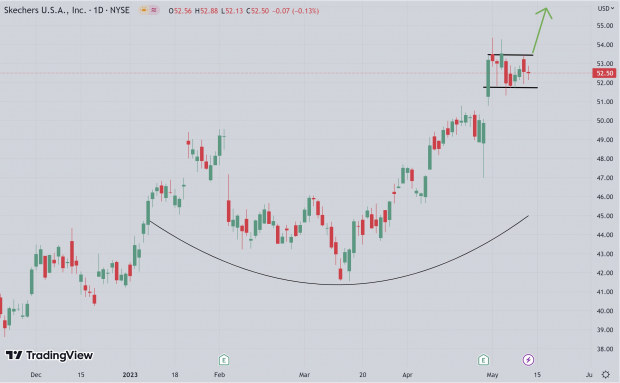 Image Source: TradingView
D.R. Horton
D.R. Horton is one of the leading national homebuilders, primarily engaged in the construction and sale of single-family houses both in the entry-level and move-up markets. D.R. Horton’s operations are spread across 110 markets in 33 states.
DHI has been a steady performing stock over the last 10 years. In that time, it has put up an annualized return of 16%, beating the index’s 12.4% annualized return.
Additionally, DHI is part of the Building Products – Home Builders industry in Zacks Industry Rank. Home builders have been one of the strongest industries in the market this year, surprising most, who thought housing would get crushed as the economy slows.
Nonetheless, it charges higher. Home Builders are in the top 3% of industries in the Zacks Industry Rank, considerably outperforming the market and demonstrating the momentum of the industry.
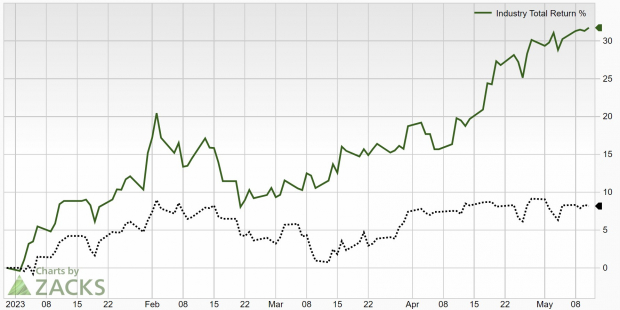 Image Source: Zacks Investment Research
D.R. Horton has a convincing technical chart pattern as well. After building and breaking out of a bull flag in the first few months of the year, DHI is coiling again for another momentum breakout. Like SKX, the stock gapped up, and is holding right near its high of the year. This is very bullish price action.
If the price can break out above the $110 level, more buyers should step in and send the stock to new all-time highs. But, if the stock trades below the $106 level, the setup is invalid.
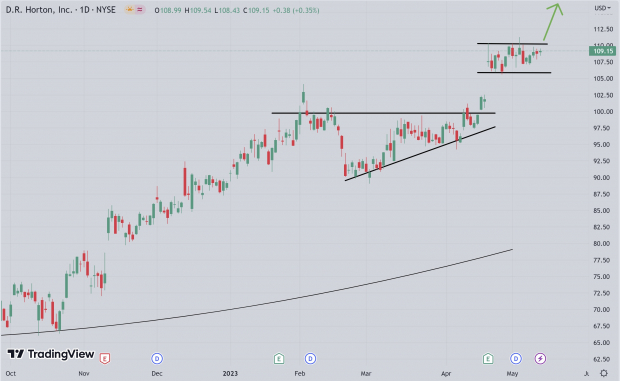 Image Source: TradingView
Meta Platforms
Meta Platforms META is the strongest performing stock in S&P 500 this year. The stock is up a very impressive 96% YTD. Even after collapsing a brutal -75% in 2022, META stock has returned 800% over the last ten years, which is 24% annualized.
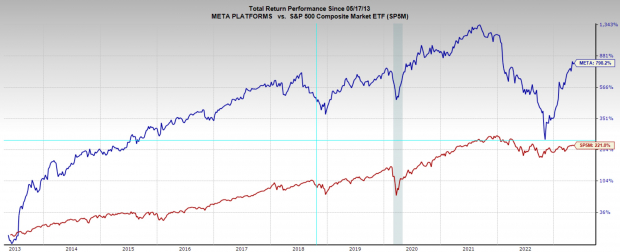 Image Source: Zacks Investment Research
Like the other stocks, META has been gapping up and holding key levels. On this chart I have marked the $220 level, which was the pre-Covid highs, an important level for many stocks.
After trading through that level, META has built out a clear bull flag. If META can trade above the $240 level, it should make another push higher. Alternatively, below the $230 level and the setup is invalid.
But, if the price trades below $230, and then holds the pre-Covid level of $220 it may build out a secondary base to trade from. Because META is up nearly 100% this year, it is possible the stock will take some time to rest, although the momentum is clearly strong in this one.
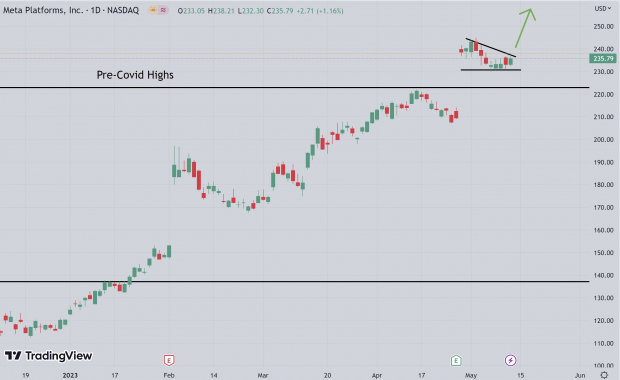 Image Source: TradingView
Bottom Line
When trading momentum stocks it is critical to set a trading plan and stick with it. Even more important is to be very mindful of risk management. Picking a stop loss and knowing exactly how much you may lose on the trade is the most important decision in the setup.
— Ethan Feller
Today, you can download 7 Best Stocks for the Next 30 Days. Click to get this free report.
Source: Zacks
