I have been running my Dividend Growth Portfolio since 2008 to demonstrate how dividend-growth (DG) investing works. The portfolio is not a back-test or a model. It has real stocks and real money, and it requires real-time decisions to manage.
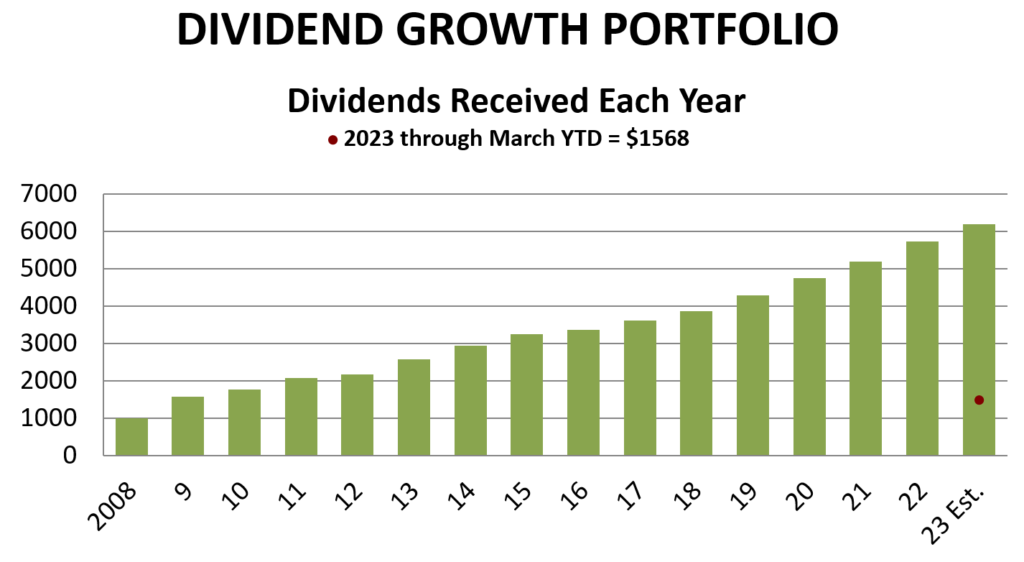
The main financial goal of the portfolio is to generate a reliable, ever-increasing stream of dividends in meaningful amounts, like this:
 Source: Author
Some people think that dividend-growth investing is boring. I don’t, and that graph shows why.
I find the process of finding, buying, and collecting dividend-growth stocks to be fascinating. I still remember my sense of disbelief when I discovered that there are companies – some big and well-known, others obscure – that increase their dividends every year. That seemed hard to believe, but it turns out that there are hundreds of them.
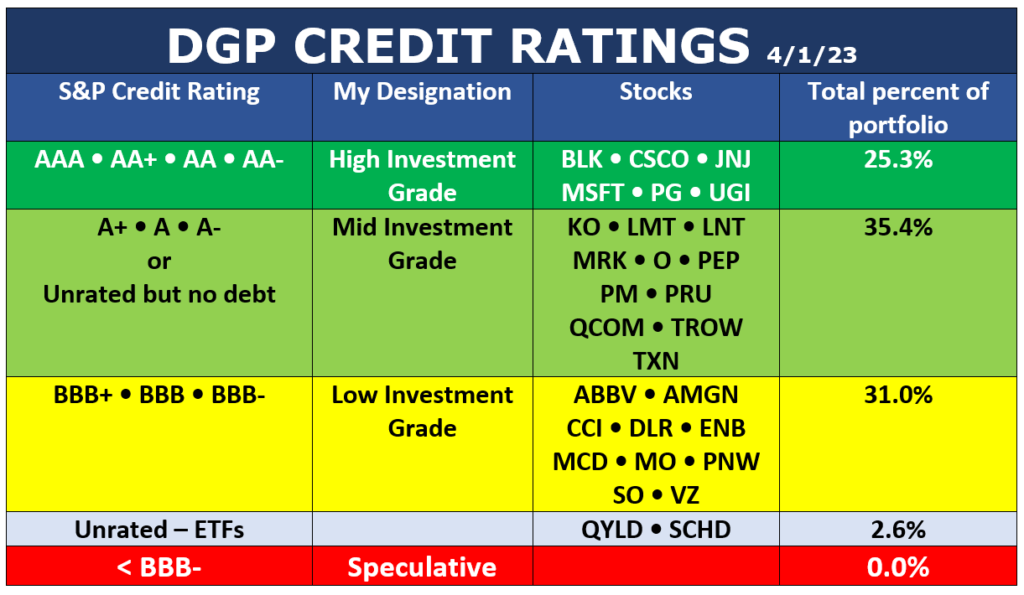
As one might expect, DG companies must be financially sound, or otherwise they wouldn’t even pay a dividend, let alone increase it every year. With March’s bank fiasco in mind, I decided to create a table of credit ratings for every stock in my portfolio.
I consider credit ratings (along with many other factors) when I pick stocks to buy, and I would never pick a stock with what is known as a Speculative credit rating. Under Standard & Poor’s multi-step system, they have 10 Investment-Grade credit ratings, the lowest of which is BBB-. All the ratings beneath that are considered Speculative or worse.
Here’s how my holdings stack up as of the beginning of April:
 Source: Author, based on S&P credit ratings
As you can see, every stock has an Investment-Grade credit rating. A couple of ETFs are unrated, and as we will see in a little while, I jettisoned one of them this month.
Let’s move along to my portfolio activities in March, which include my first sale of the year.
Purchasing a New Utility
I like utilities. They fly under the radar for many investors, but I like them when they have legal monopolies, operate under reasonable regulators, display sound finances, and of course when they’ve been raising their dividends for years.
I originally considered five utilities to add to my portfolio, which already has three. I put the candidates through rigorous scoring systems to evaluate overall quality, dividend practices, and financials. And of course, before buying one, I calculated whether it was selling at a fair price.
Midway through the process, I eliminated one company – Duke Energy (DUK) – from consideration because its scores were falling short of the other candidates. That left these four candidates:
- American Electric Power (AEP)
- Evergy (EVRG)
- Public Service Enterprise Group (PEG)
- WEC Energy (WEC)
This table shows how they scored.
 Source: Author
As you can see, the competition was close. All four companies are investable, in my opinion. They all have above-average Quality and Dividend scores, as indicated by the green shading. They all have average Financial scores (yellow shading) that are fine for utility investments.
In the end, I selected Evergy, Inc. (EVRG) for the coveted spot in my portfolio, for two reasons that stood out a bit from the others: It has the best yield of the bunch, at 4.0%, and by my reckoning, it is the most undervalued among these stocks, being available for 16% below its fair price.
Let’s take a closer look at Evergy.
Evergy, Inc. (EVRG), is a $14 B, large-cap electric utility in the Midwest.
Through its operating subsidiaries (Evergy Kansas Central, Evergy Metro, and Evergy Missouri West) the company provides energy to 1.7 million customers in Kansas and Missouri. Evergy was formed in 2018 from the merger of Westar Energy and Kansas City Power & Light. The company traces its history back to 1881.
Evergy’s operations include the generation, transmission, distribution, and sale of electricity in Kansas and Missouri. Electricity is generated from coal, hydroelectric, landfill gas, uranium, and natural gas and oil sources, as well as solar, wind, and other renewable sources. Evergy’s customers include residences, commercial firms, industrial companies, municipalities, and other electric utilities.
The following shows Evergy’s service and operating territory.
 Source
There are three analytical snapshots that I created for Evergy. First, its overall quality:
 Source: Author, using data from information providers shown
The highlight of this graphic is Evergy’s Very Safe dividend score from Simply Safe Dividends. The only non-green category is Value Line’s Financial Strength grade (B++, which is an Average grade). I will go into Evergy’s financials with my own analysis in a minute.
Next, here is Evergy’s Dividend Snapshot:
 Source: Author, using data from Simply Safe Dividends and Dividend Champions
Besides the Very Safe dividend safety score, Evergy ranks above average in its yield, most recent dividend increase, and 5-year dividend increase record. I judge its 10-year dividend record to be choppy, but it has smoothed out lately. Overall, Evergy presents a solid Above Average dividend resume.
My third area of inquiry is Evergy’s financials.
 Source: Author, using data from Value Line, Simply Safe Dividends, FASTGraphs, and Evergy
Utilities do not often knock your socks off with their financials. For one reason, their capital-intensive business models require incessant maintenance and upgrade expenditures that can lead to high debt levels and rising share counts. Plus, utilities must obtain state approval for every pricing decision (i.e., rate change) that they make.
The huge upside of state regulation, of course, is that regulated utilities get to operate as legal, state-sanctioned monopolies, which obviously is a great business advantage.
Comparing four utilities at once gave me a good feel for what to expect from the scores. As shown earlier, Evergy ranked either first or second in every Snapshot summary, and it also offers the highest yield and best valuation among the companies that I examined. Therefore, I considered it the “winner” of this utility derby.
The only question left to answer was Evergy’s valuation. I used multiple models and sources to estimate Evergy’s valuation. The purpose of valuation analysis is to estimate how the company’s actual price relates to its fair or intrinsic value. Here is my conclusion:
 Source: Author
I think that EVRG is selling at a discount.
Given the foregoing information, I purchased 12 shares of Evergy on April 3, 2023.
 Source: Author
Because Evergy is a new small position, well under 3% of the portfolio, I will look for continued opportunities to buy more shares using dividends collected in the future.
Ending the QYLD Experiment
The second major thing I did in March was conclude my experiment with QYLD.
In 2021, I made a video about GlobalX’s Covered Call NASDAQ 100 ETF (QYLD). Due to its high yield, QYLD was a hot topic at the time. The video became my most-viewed ever, racking up more than 232,000 views so far. Click on this image to see it.
 QYLD generates income by selling covered calls on the stocks in the tech-laden Nasdaq 100 index. The premiums from the covered calls allow GlobalX to keep QYLD’s yield around 12%, no matter how the fund’s price changes in the market. The stocks themselves generate little in dividends; most of QYLD’s distributions come from covered-call premiums.
In October, 2021, I decided to add a small experimental position in QYLD to the DGP, even though QYLD is not a dividend-growth stock. The idea of holding a high-yield/no-growth instrument in a dividend-growth portfolio is that it can spit out high income “forever” to fund the purchase of true DG stocks for the portfolio.
The idea works, but I’ve become dissatisfied with collecting variable dividends that don’t grow. I would rather own true DG stocks than a variable income generator. Certainly adding to my attitude is the fact that the timing of my purchase was lousy, with the result that QYLD’s price has dropped more during my ownership than the dividends I collected.
On April 3, I sold my stake in QYLD. My selection to replace it is Prudential (PRU), which is a small position in the portfolio that sports a high yield itself of 6.0%.
Here’s the summary of the sale and replacement.
 The sale of QYLD and replacement with Prudential will lower my income run-rate temporarily, until dividend increases and reinvestments wipe out the deficit. That won’t take long, and in a couple of months it will be as if the QYLD experiment never happened.
For the record, I lost about 24% of my purchase price for QYLD while I owned it, but well over half of that was returned in dividends received, leaving the net outcome of the experiment as a loss of about 9%.
The dividends I received from QYLD were reinvested into other companies, which have been producing dividend returns since December, 2021. Those are not reflected in the table above, nor in my summary of the experiment, because they are spread throughout the portfolio and took place over 17 months.
What did I learn from the experiment? These are my observations:
- Over time, it seems all but inevitable that the dividends from QYLD would have overcome the capital losses, since it is unlikely that QYLD, whose value is linked to the stocks in the Nasdaq 100 Index, will ever go to zero.
- The “12% yield” enticement of QYLD is both true and misleading at the same time. Each monthly distribution is capped at about 1% of QYLD’s net asset value. (The excess undistributed cash is reinvested back into the portfolio). So as the market price of QYLD varies, the monthly distributions vary along with it. During my holding period, QYLD’s market price fell overall. So while the yield stayed roughly at 12% annually, that yield was based on a declining price, which meant that the monthly distributions (in dollars) fell in concert with its price. To illustrate: My first monthly dividend from QYLD at the end of 2021 was $9.21. The most recent dividend, in March, was $6.93. That’s 25% lower, which corresponds almost exactly to the price decline of QYLD while I owned it.
- The dividend payouts, of course, rise when QYLD’s price rises, because that raises the monthly cap accordingly. The overall outcome is that the monthly dividends vary, but whether they go up or down during your holding period depends on the price performance of the Nasdaq 100 over the same period.
- When the Nasdaq 100 is rising in price, QYLD normally does not rise as fast, because its covered-call strategy effectively caps how much of the Nasdaq 100’s gain is reflected in QYLD’s price. QYLD does not get the benefit of price rises beyond a small fraction. That, of course, is built into the design of QYLD, as I covered in my video. QYLD is a vehicle for generating income, not for generating capital growth. I knew that when I bought it.
Portfolio Update
Let’s step back now from March’s activities for a broader view.
There are three reasons that dividends go up in a DG portfolio:
 Source: Author
All three of these reasons were illustrated in March.
Reason #1. Stocks increase their dividends
The following table shows the DGP’s dividend-increase record so far in 2023. New increases announced since last month are highlighted in yellow.
 Source: Author, from company announcements
As you can see at the lower right, the portfolio’s annual income run-rate has increased so far this year by 2.3% from dividend increases alone. By the end of the year, I expect that number to reach about 5%.
I am not required to do anything to make this happen. My only involvement is to pick excellent companies that raise their dividends, buy them, and own them.
Reason #2. Reinvesting dividends
The second reason the portfolio’s dividends go up is that I reinvest them. Since dividends are paid per share, each additional share purchased causes the portfolio’s income to increase.
This table shows how my dividend reinvestment program is going so far in 2023. This month’s purchase is highlighted. In contrast to dividend increases, dividend reinvestment is something that I am responsible for as the owner of the portfolio.
 Source: Author
By the end of the year, I expect that the reinvestments will add between 3% and 4% to the portfolio’s dividend run-rate.
Reason #3. Portfolio adjustments
This category covers things like trimming or selling a stock, deciding how to replace it, and executing those decisions. That pertains this month to the termination of QYLD and replacement purchase of Prudential. That is the only adjustment that I have made so far this year.
Over the years, I haven’t churned the DGP very much. Every stock or fund I buy is one that I expect to hold “forever.” Not everything works out that way, but my portfolio turnover rate rarely exceeds 10% per year, and some years it is zero.
 Overall, the three categories of dividend activities in March netted out to an annual drop of $16 in annual income, plus $41 left over in cash from the QYLD/Prudential exchange. In return, I got rid of an annoying holding in the portfolio and can return to straight dividend-growth investing. The small drop in annual income will be erased by dividend raises and next month’s reinvestment. Altogether, a good trade-off.
And that wraps up this month’s DGP review. If you want to see the positions in the portfolio at any time, its status as of the end of the previous month is always available here. That location also has an archive linking to all the articles and videos that I have published about the portfolio.
Remember, I do not present this portfolio as best or a model for what anyone else should do. DG investing has many flavors. I show what I do and why I do it, in the hopes that other investors will find it inspirational and educational for their own purposes.
Thanks for reading!
-–Dave Van Knapp
The name of the ONE stock (ticker symbol and all) that has helped over 170,000 people discover how to gain their financial freedom... Learn More.
Source: Dividends & Income