
For my February dividend reinvestment, I added shares of what I think is the best all-around dividend-growth ETF available.
I don’t make that statement lightly. I have studied dividend ETFs for nearly a decade as they have grown from a niche product to a major genre of ETFs. I haven’t publicly ranked them for many months, so this month I decided to round them up and grade them again.
Finding Eligible Dividend-Growth ETFs
The ETF.com website covers more than 3000 ETFs. Using three simple screens narrows those down to 82 U.S. dividend ETFs:
- Asset Class = Equity
- Geography = U.S.
- Channel = Dividend ETFs
To narrow that universe further, I applied two approaches that I have used in the past.
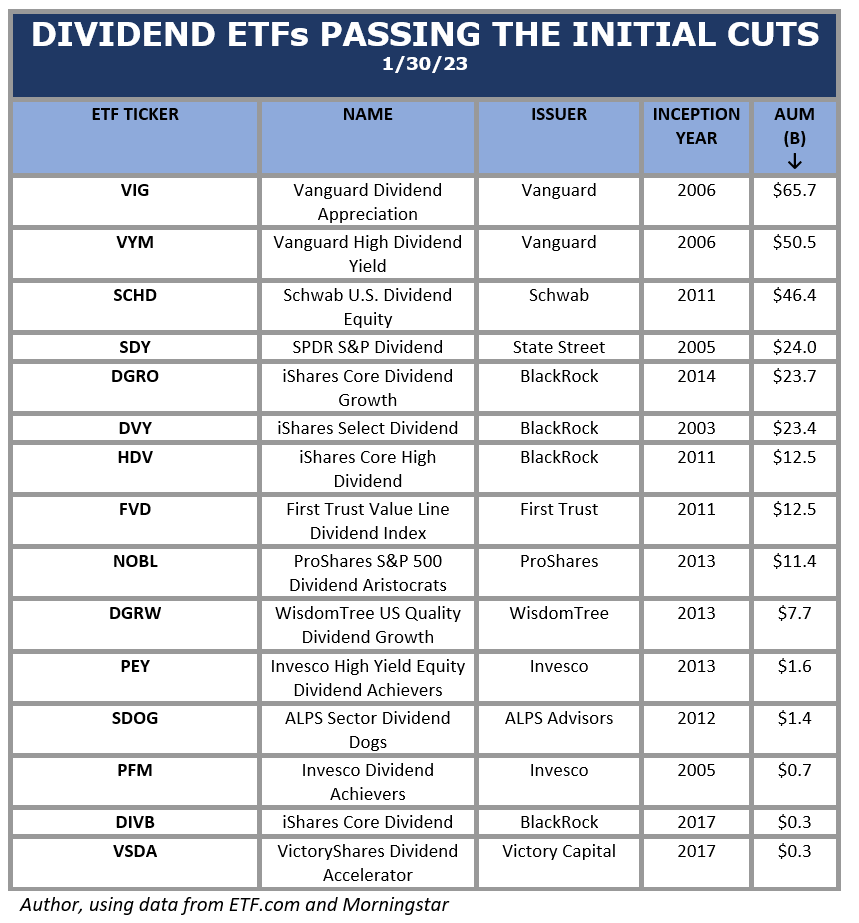
First, I arranged the ETFs by size and identified that ones that have attracted a lot of investor money over the years. These large, older ETFs have fairly long track records that can be analyzed. I drew this year’s cutoff line at $11 B in assets. That captured the 9 largest dividend ETFs.
Second, I identified every ETF – no matter its age or size – that has a current dividend-increase streak of 5 or more years. That’s the same requirement I use for DG stocks. Obviously, to make it into this category, the ETF must be at least 5 years old. I found them by looking up every ETF manually and checking its dividend-growth record on Simply Safe Dividends. That turned up 5 more ETFs, including a couple that have only been around since 2017 and therefore just became eligible to make the cut. That step resulted in a starting universe of 14 ETFs.
Finally, I kept one other, despite it not getting through the size or 5-year screens, because it is quite large, has been in previous derbies, and scores pretty well on my rating system despite a recent dividend cut.
Please note that in this search, I am considering only ETFs that own companies that pay dividends and pass them along to you after subtracting out their expenses. I am not considering ETFs that generate dividends by selling covered calls or use similar “alternative” strategies.
Here’s the opening lineup of 15 dividend ETFs that survived the steps described above. They are listed from largest to smallest using Assets under Management (AUM, shown in the last column).
 Rating the ETFs
 Rating the ETFs
As I do with stocks, I rate ETFs based on qualities that are important to me as a dividend-growth investor. I am most interested in ETFs that can pay me decent-sized dividends that grow consistently.
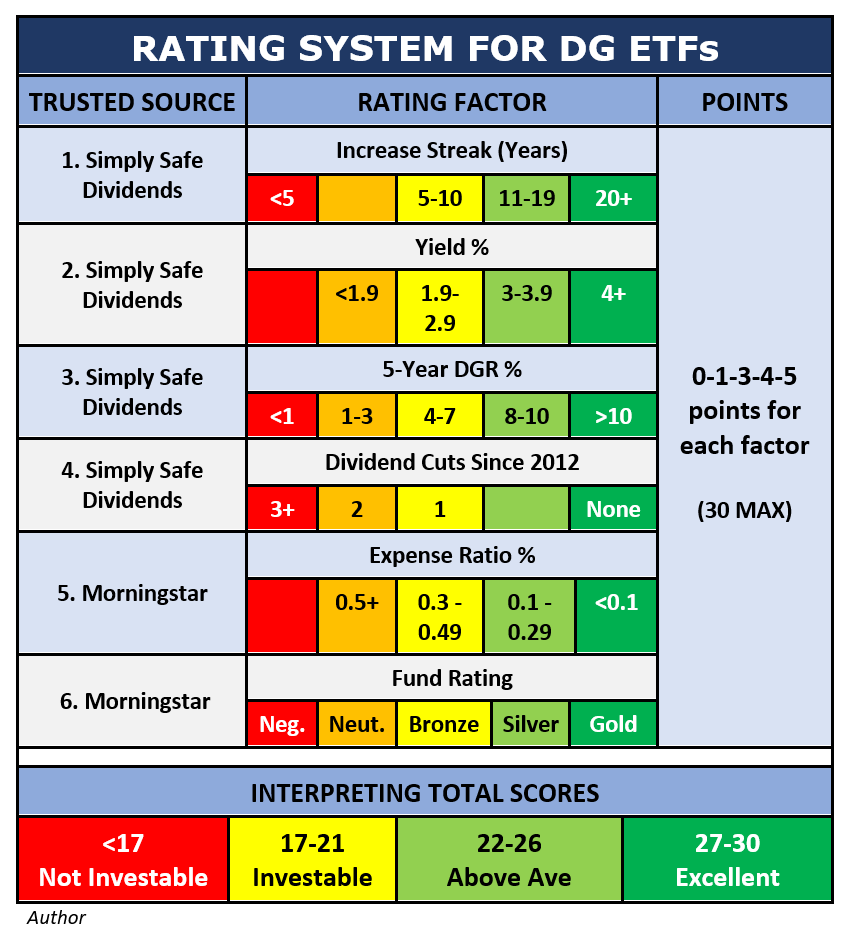
Here is the scoring system. I’ll describe the factors first, then display a grid that shows how I grade them.
- Dividend Growth Streak
I want ETFs that raise their dividend every year. That’s the same quality that I look for in stocks. Not many ETFs raise their dividend every year, even if they have “Growth,” “Aristocrats,” or “Achievers” in their names. As with stocks, I want a minimum of 5 straight years of increasing payouts.
- Yield
All else equal, higher yield is better, so I award more points for better yields.
- Dividend Growth Rate
Even if an ETF does not raise its dividend every year, it may have a general upward trend in its dividend payouts. I grade the ETFs by their compound annual dividend growth rates over the preceding 5 years. Faster growth is better.
- Dividend Cuts
If an ETF cannot raise its dividend every year, how often has it cut the dividend? I looked back 10 years (2013-2022) and noted how many times each ETF has cut its dividend on an annual basis. Several dividend ETFs have no cuts over the past 10 years, so it’s not an unrealistic standard.
- Expense Ratio
The returns from an ETF come to the investor after its expenses have been deducted, so some investors don’t think that the expense ratio is important. I do think it is important, especially with dividend-growth ETFs, because every dollar the ETF provider takes out for fees and expenses is one less dollar that can be returned to shareholders. Expense ratios impact dividend payouts directly.
- Morningstar Fund Rating
Morningstar rates funds on a Gold-Silver-Bronze scale. They say that their ratings are meant to be forward-looking, and that they express their analysts’ opinions about each fund’s ability to beat its peers after accounting for fees and risk over a market cycle.
Morningstar is a total-return shop, so when they say “beat its peers,” they are referring to total return expectations, not specifically to dividend performance. That said, I think that Morningstar does a good analytical job, so I include their ratings as a factor in my own grading system.
Here is how I grade the six factors.
 The table may look complex, but it is easy to interpret.
- Each of the 6 factors can earn from 0-5 points.
- Total possible points = 30.
- Colors tell the story: Excellent scores are dark green, above-average scores are light green, OK scores are yellow, below-average scores are orange, and failing scores are red (and receive no points).
If an ETF cannot garner 17 points on this system, I would not consider investing in it. There are plenty of better alternatives.
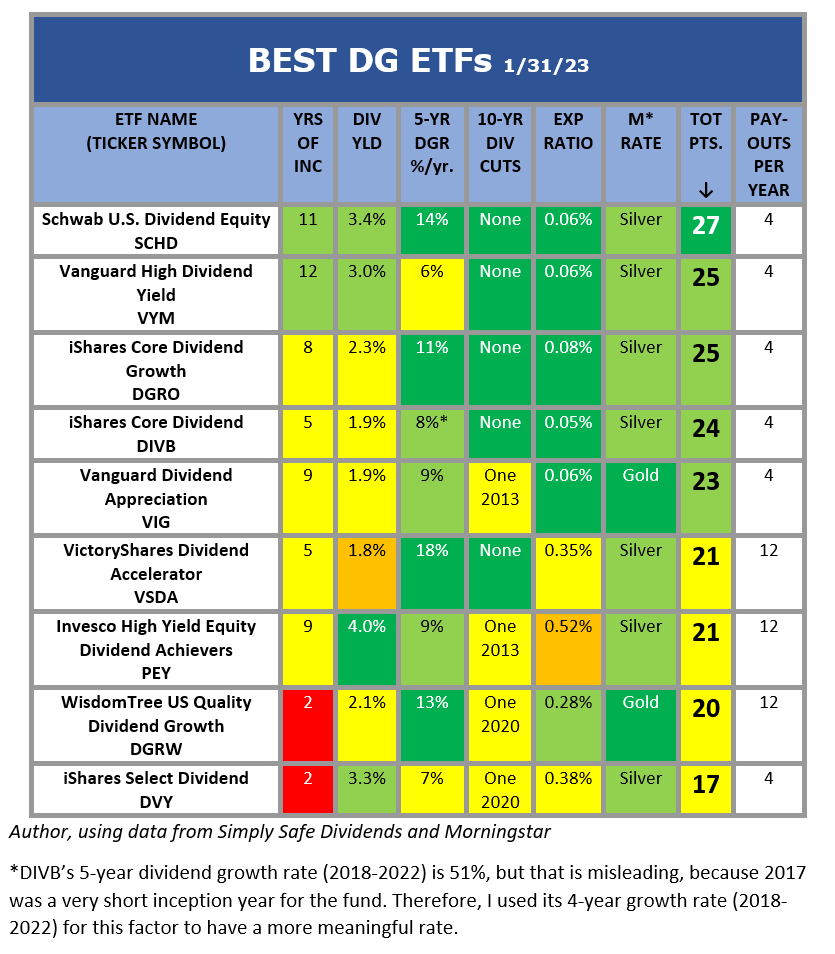
Using that system, the two tables below show how I rate the 15 candidates. I’ve divided the ETFs into two categories: Investable and Non-Investable. Of course, these are my personal opinions based on my scoring of the data.
Note that the last column – Payouts per Year – is not involved in the scoring, but I’ve included it as useful information.
And the Winner Is… Schwab’s U.S. Dividend Equity ETF (SCHD)
 And the Winner Is… Schwab’s U.S. Dividend Equity ETF (SCHD)
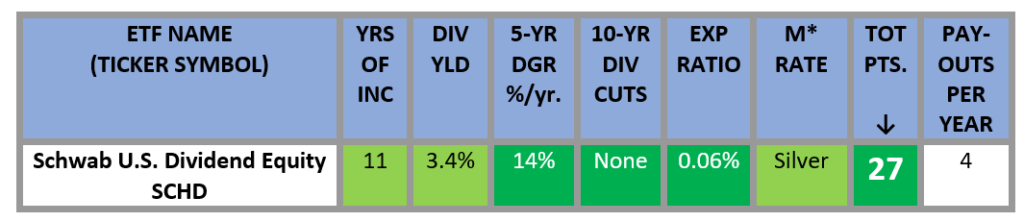
SCHD wins my best-in-class award again. It has finished first every time I have rated dividend-growth ETFs over the past several years.
 As all experienced investors know, no single security is best for everyone. This is my personal choice, and it obviously reflects my personal biases.
There are tons of things to like about SCHD:
- It has raised its annual dividend every year since its launch in 2011.
- All of its individual scores are green – the only ETF to do that.
- It has an above-average yield (3.4%) combined with outstanding growth (14% CAGR over the past 5 years).
- SCHD doesn’t chase yield, a practice that can be a trap. While it favors stocks with good yields, it also applies several quality screens to weed out the weaker companies. Only high-quality stocks make it into SCHD’s portfolio.
- It has a very low expense ratio – in the lowest quintile of expense ratios for all the ETFs that Morningstar covers.
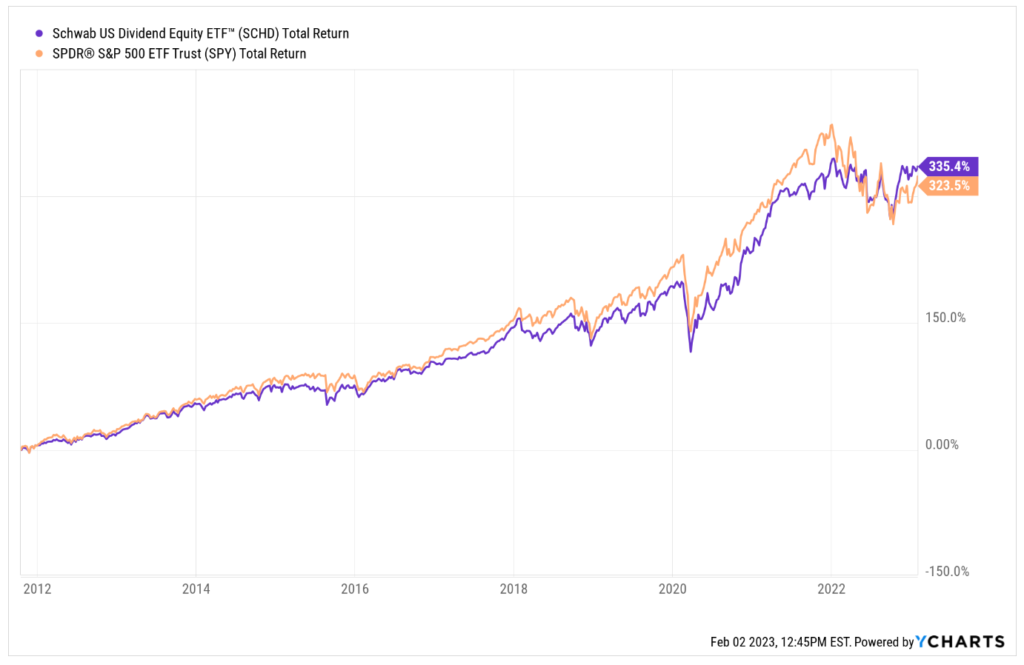
My ratings pay no attention to total return, but SCHD has shined there too. For example, it has beaten the S&P 500 (with dividends reinvested) since SCHD’s launch. This chart compares SCHD (purple) to SPY (orange), which is the largest S&P 500 ETF.
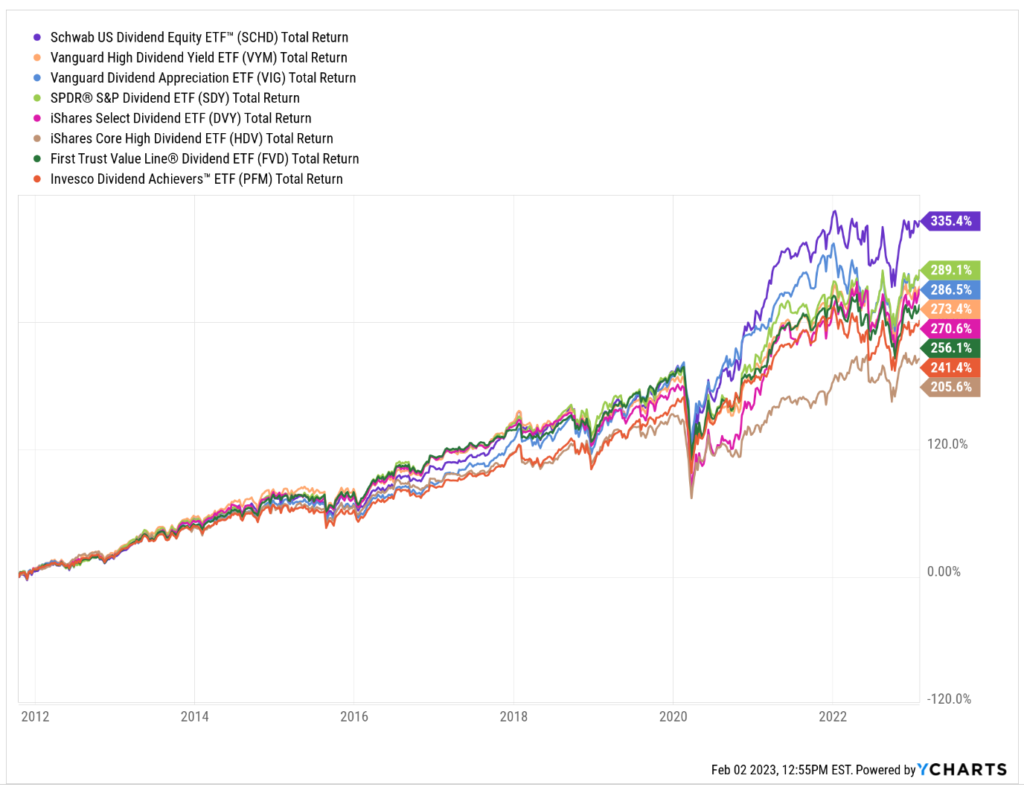
 Not only that, SCHD has higher total return since its launch than any of the other dividend ETFs that have been around as long. Again, SCHD is the purple line at the top in the following chart.
How Does SCHD Do It?
 How Does SCHD Do It?
SCHD replicates an index called the Dow Jones U.S. Dividend 100 index. The index guides SCHD’s management not only on what stocks to hold, but also how to manage them.
Here are the significant outcomes of that arrangement.
- SCHD holds only stocks that have paid dividends for 10 or more consecutive years.
- The lower 50% of those by yield are dropped from consideration.
- REITs are eliminated.
- SCHD scores the remaining universe of stocks equally on four metrics:
- Cashflow/debt (i.e., financial health)
- Return on equity (profitability)
- Yield
- 5-year dividend growth rate
- The top 100 stocks under that scoring system make it into the portfolio.
- The portfolio is reconstituted each March and rebalanced every three months.
- During reconstitution, an incumbent stock stays in if it finishes in the top 200 of the rankings; this helps reduce portfolio turnover.
- Rebalancing is not equal-weight, but is proportional to each stock’s market capitalization. Larger companies get more weight, up to 4% of the portfolio at the time of calculation.
- Each sector is limited to 25% of the total portfolio.
Because SCHD reconstitutes its portfolio each March, and March is coming up, I am not going to spend any time on what SCHD holds right now. Some of the stocks and most of the weightings will change in a month.
Instead of focusing on the stocks in SCHD right now, let us instead consider what kinds of stocks SCHD buys and how it manages them.
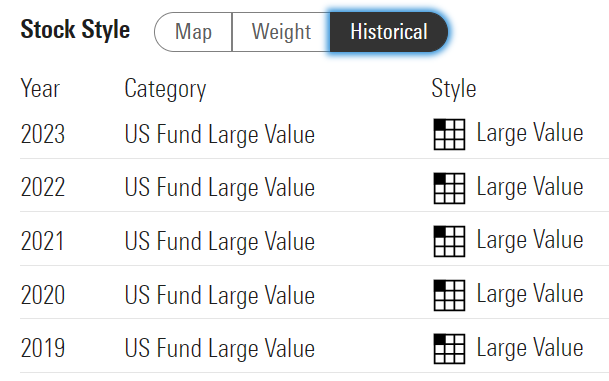
First, Morningstar’s style-box categorization of SCHD over the past 5 years has held steady: It is a Large Value portfolio of U.S. stocks.
 Morningstar
The Large Value categorization comes as no surprise. Stocks with strong dividend records tend to be value stocks rather than growth stocks, and SCHD’s weighting system favors large-cap stocks.
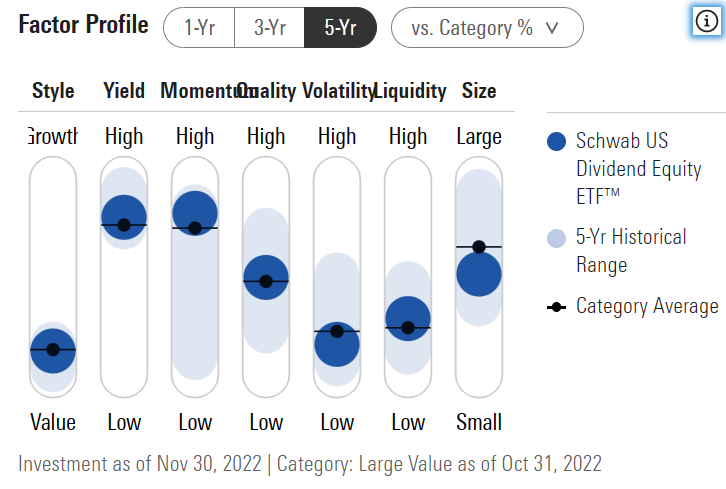
Next, let’s look at Morningstar’s factor analysis. Factor investing has become big over the last decade. Morningstar analyzes how much the stocks owned by SCHD have been exposed over the past 5 years to what it says are “seven factors that are widely accepted in the industry as key drivers of risk and return.”
 Morningstar
Here’s what the graph tells us:
- The left-hand bar shows that SCHD’s stocks tend toward Value rather than Growth. That’s no surprise, as explained earlier.
- The next bar shows that SCHD’s stocks tend to have higher Yields than average. Again, that’s what we would expect based on how SCHD scores stocks. It drops the 50% lowest yielders from its universe early in the selection process, then it also uses yield as a scoring factor in grading the remainder.
- SCHD currently has a high exposure to the Momentum factor, but notice that the light-blue band shows us that its exposure to momentum has varied from very high to very low over the years. I’m frankly not sure whether this bar tells us anything useful.
- The 4th bar indicates exposure to the Quality factor, which Morningstar says “…describes the profitability and financial leverage of a company, based on an equally weighted mix of trailing 12-month return on equity and debt-to-capital ratios.” SCHD scores mid-range on this factor. That surprises me, since SCHD explicitly uses ROE and leverage when it scores stocks. I would therefore expect SCHD to rank higher on this measure.
- The next bar shows us that SCHD’s stocks tend to have low price volatility. In my own picking of dividend-growth stocks, I often end up with low-volatility stocks myself, so this comes as no surprise.
- The liquidity factor refers to share turnover. It doesn’t shock me that SCHD’s stocks tend to have low turnover. Large-cap value stocks don’t get traded around like meme stocks or other “hot” names.
- On the far right, we see that SCHD’s stocks tend toward the large-cap category. Once again, that is no surprise, because large companies get more weight in SCHD’s portfolio.
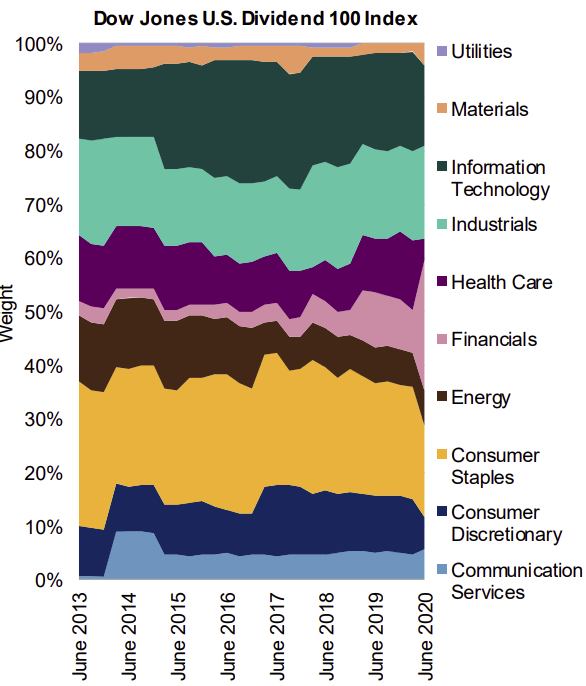
The next graphic, while a couple years old, is instructive on how SCHD’s periodic reconstructions and rebalances, over time, can cause SCHD’s composition to change significantly.
 Dow Jones Indexes, original source unavailable
Here are two examples of how SCHD has changed over time.
- At the top in light purple, you can see Utilities fade to zero. That trend has continued to today: Utilities make up only 0.3% of SCHD’s portfolio per the index’s latest factsheet.
- Near the middle in pink, you can see Financials expanding from a small proportion to significant size. That expansion has continued to the present day: The Financial sector currently is the largest at 21.6% of the index, as shown in light blue on the next chart.
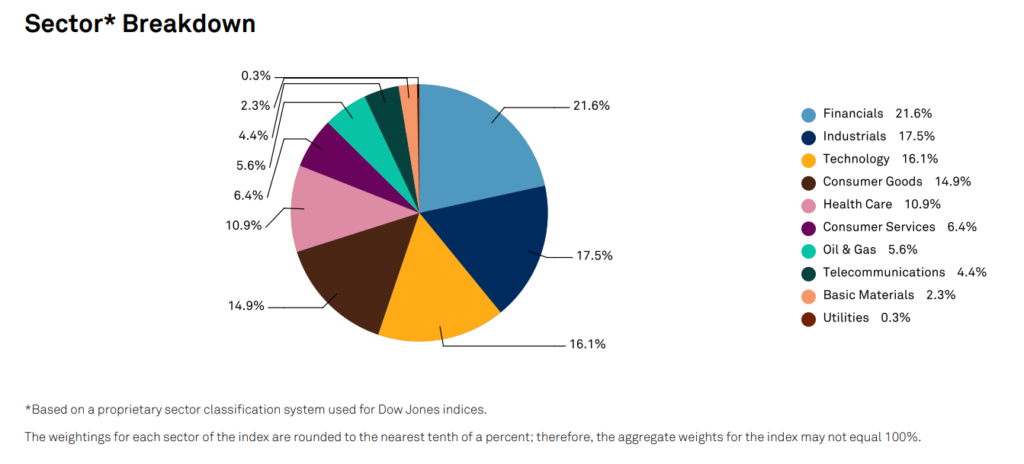 Dow Jones U.S. Dividend 100 Index Factsheet, data dated January 31, 2023
Here’s how I have come to see SCHD: It is a stock selection and management system that results in a dividend-growth machine.
SCHD’s index’s proprietary stock-scoring system, combined with its annual recomposition and quarterly rebalancing, have resulted in a dynamic portfolio that has delivered not only good dividend yields and consistent dividend growth, but also market-beating total returns.
SCHD changes the stocks around from time to time, brings some new ones in and replaces others, and it also adjusts the weights every so often. SCHD has been doing this for 11 years now, and I see no reason that it will not continue to produce good returns in the dividend-size, dividend-growth, and total-return spheres.
Buying More SCHD
In my Dividend Growth Portfolio, I reinvest dividends every month, and based on the above analysis, I decided to add more shares of SCHD for my February, 2023 reinvestment.
I think that SCHD is selling at a fair price right now. ETFs are a pain to value, because their true valuations are functions of the valuations of the individual stocks in them. SCHD holds 100 stocks.
Instead of valuing every one of them and weighting those valuations to match their weights in the portfolio, I prefer to get an approximate valuation for ETFs by using the relative-yield metric on the ETF itself.
Relative yield is one of the valuation models that I routinely use in valuing stocks (see this video). For ETFs, it entails comparing the ETF’s current yield to its 5-year average yield. To determine the latter, I simply eyeball a 5-year chart of the ETF’s yield.
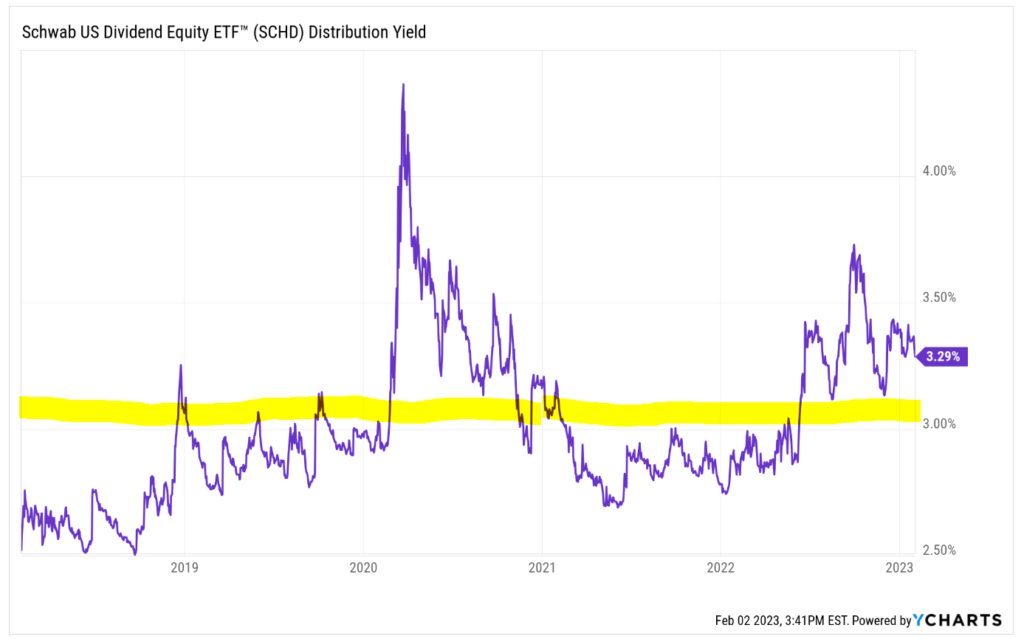 SCHD’s yield over the past 5 years has varied from 2.5% (near the beginning of the chart) to 4.5% (during the pandemic). The yellow stripe is my guesstimate of the average, which looks to me to be about 3.1%.
Based on this, I consider SCHD to be OK to buy any time its yield is at 3.1% or more. Currently, SCHD easily clears that hurdle. Its current yield is 200 basis points higher than its 5-year average.
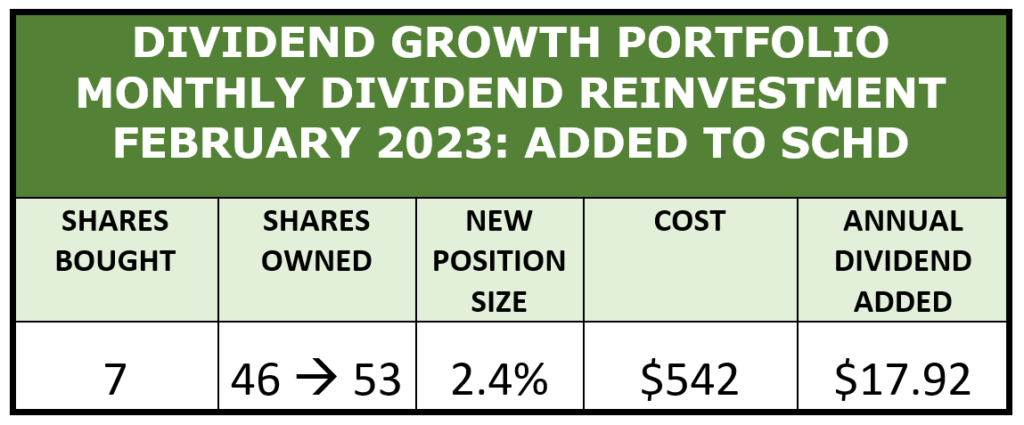
So on Friday, February 3, I bought 7 shares of SCHD, using dividends accumulated over the past month.
Portfolio Review
 Portfolio Review
Now let’s switch gears and take a birds-eye look at the whole portfolio. I will keep this brief, because of the length of the discussion of SCHD above. If you want to see the whole portfolio as of February 1, before the purchase of SCHD, click on the monthly update here.
Reinvesting dividends is one of three reasons that my dividend stream rises relentlessly.
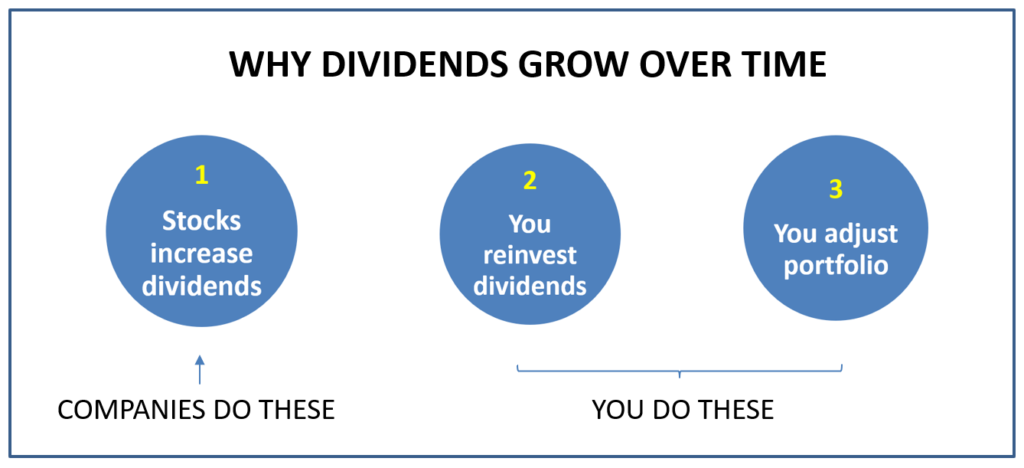 I haven’t made any portfolio adjustments yet this year, but the first two reasons – dividend increases and dividend reinvestments – are well underway in 2023.
Here’s what has happened so far in each of those categories. New information since my last report is highlighted in yellow.
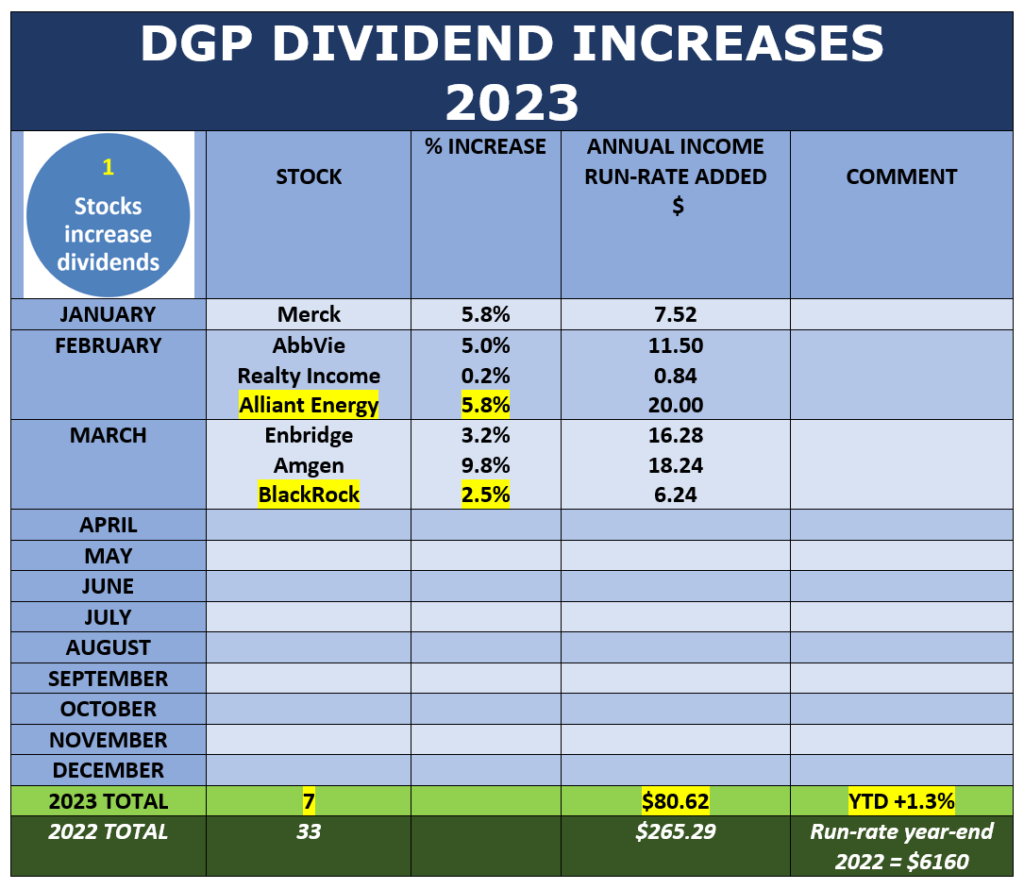
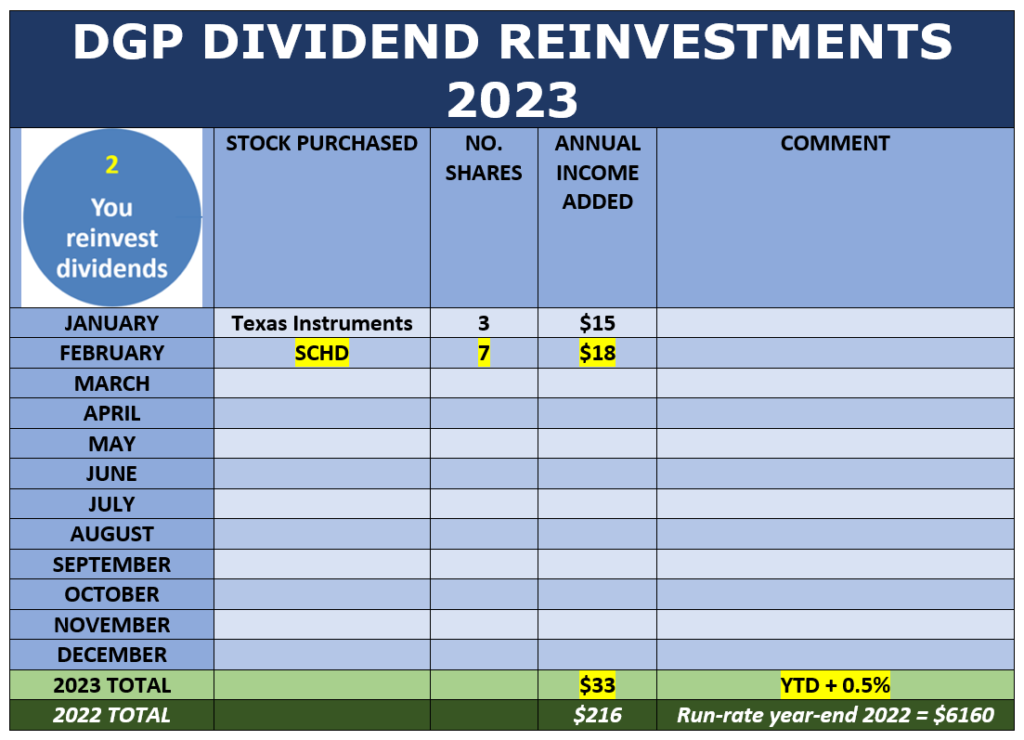 You will note that just through these two mechanisms alone, nearly 2% has been added to the portfolio’s annual dividend run-rate in 2023 – and it’s only February!
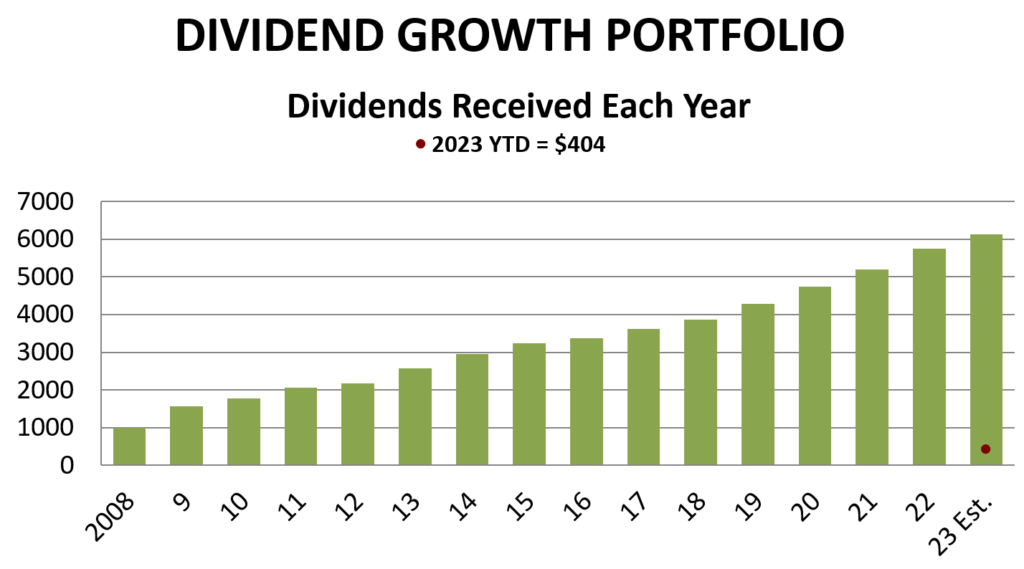
With the addition of the new shares of SCHD, the portfolio’s annual dividend run-rate has advanced to a new high of $6218, which equates to a yield on cost of 13.3%.
I will finish this report by displaying my favorite chart for this portfolio. This last chart really sums up why I do this.
 And that wraps up this month’s dividend reinvestment and portfolio review. Thanks for reading!
Remember, the DGP is not presented as best. It is not a model portfolio, nor is it tailored to growth, harvesting, or any particular age group. Rather, it is an all-around dividend-growth portfolio that demonstrates in real-life what you can accomplish with the dividend growth strategy. I show what I do and explain why I do it.
-–Dave Van Knapp
After researching income stocks for over 30 years, I've come up with a one of a kind dividend portfolio. With the right 20-30 stocks, you can collect a dividend check every single day the market is open. That's over 260 dividend checks per year. Click here for the names of these 20+ stocks.
Source: Dividends & Income
For a list of all of my articles and videos about my portfolio, see below.
Dividend Growth Portfolio Archive