
My Dividend Growth Portfolio (DGP) is a real-time, real-money demonstration of dividend growth investing.
It is not a back-test, model, or hypothetical. The DGP wrapped up 2022 in great shape.
- Yield on cost grew to 13.2%. That is a new record high, well beyond my original goal of 10%, which I passed a couple years ago.
- Total dividends received from the portfolio now exceed the initial cost of the portfolio, and they continue to move further beyond that opening amount.
- Dividends collected in 2022 grew 10.4% over 2021’s total. The total collected was a new record high.
- Total 2022 return beat the S&P 500 by 15.6%. My portfolio fell 2.8%, but the S&P 500 fell by more than 18%.
Now, let’s see how each accomplishment was achieved.
Yield on Cost Hit Record 13.2%
The DGP has two financial goals in its Business Plan.
The primary goal is to build a reliable, steadily increasing stream of dividends over many years that can eventually be used as income for retirement.
Obviously, this is a goal about cash flow, not about wealth. I try to develop an “optimal” income stream, which is not necessarily the largest possible. Optimization includes not only the dividend dollar amount, but also its growth rate, safety, and reliability.
One way to measure progress in an income-oriented portfolio is through its yield on cost (YOC). YOC measures how much income the portfolio is generating compared to the original investment. The formula is easy.
Dividend Run-rate ÷ Original Amount Invested = Yield on Cost
$6160 ÷ $46,783 = 13.2%
$6160 is the current rate at which dividends are flowing into the portfolio per year. $46,783 is how much I spent to create the portfolio in 2008. 13.2% is the current YOC.
The meaning of 13.2% yield on cost is significant: The portfolio is sending me cash dividends at a rate of 13.2% per year of my original investment.
That is the kind of income power that was the original inspiration for the portfolio.
To be honest, it was difficult to imagine back in 2008 being able to create a portfolio that would do such a thing. If someone had said in 2008, “Here’s $47,000. Create a portfolio that will generate more than $6000 cash per year in 2023 without adding any more money along the way,” I’m not sure I would have believed that was possible.
But the DGP has done it. And it’s still growing that income stream. $6160 per year is the annual run-rate at the beginning of 2023. But as dividend increases come along, and I reinvest dividends to buy new shares, the run-rate will grow throughout the year.
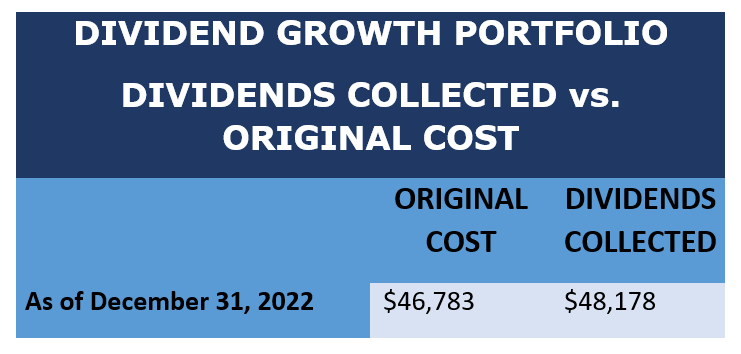
Total Dividends Exceed the Portfolio’s Original Cost
This accomplishment is way cool. Over its lifetime, the DGP has sent me more cash dividends than it took to start the portfolio in 2008.
The original cost of the portfolio was $46,783. The dividends I have received from it totaled $48,178 at the end of 2022.
 The following chart is a more dramatic way to illustrate how this has happened.
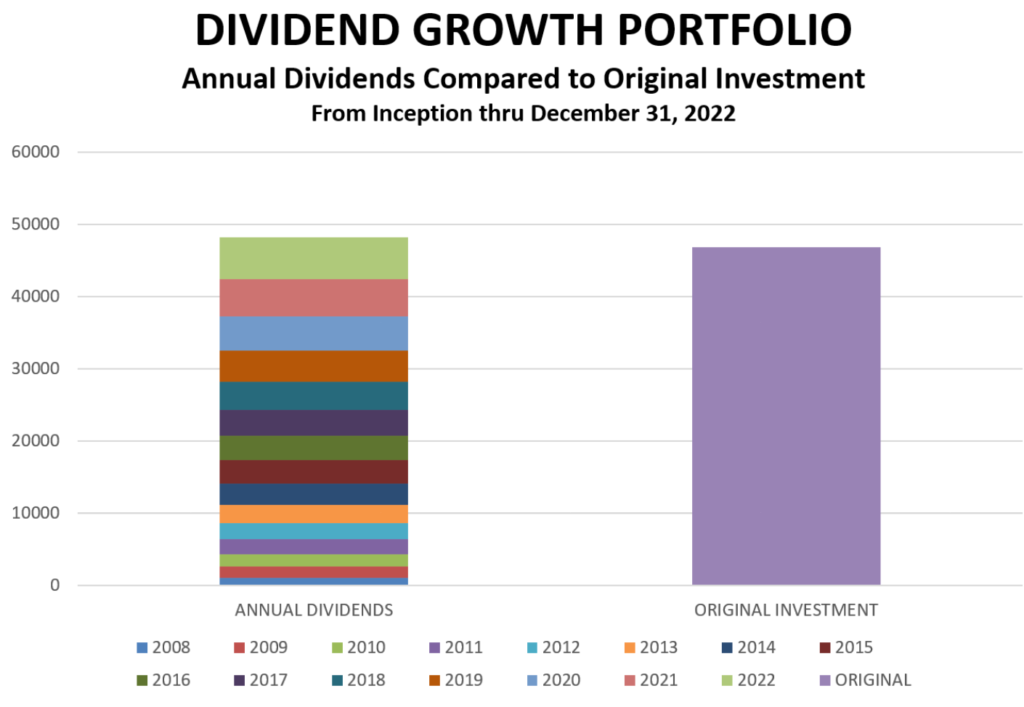 As you can see, the year-by-year stack of dividends on the left now exceeds the original cost of the portfolio shown on the right.
It took a little over 14 years to reach this milestone. But the dividends compound every year, and from the way compounding works, it will take only about half that time to repeat the feat again.
Using the Rule of 72, if the portfolio’s annual dividend growth rate stays around 10% per year, the height of the left-hand bar – the stack of dividends – will double in about seven to eight years.
In other words, in half the time it took to happen once, it will happen again. The total of dividends received will become twice the original investment.
Because DGI dividends compound, their growth is exponential. Compounding means to make money on money already made. Each year’s percentage growth is applied to a larger base than the year before, because the base now includes money made last year. The result is that each year’s growth in dividend dollars is generally more than it was the year before.
That is illustrated by the stacked left bar in the chart. There are 15 layers in the stack, each representing one year. Each layer is larger than the one below it. In fact, the last three layers (2020-2022) by themselves account for almost a third of the total height of the stacked bar.
The speed of growth would be different, of course, if new money were being added to the DGP. To compare my results with a portfolio that has new money coming in, see Mike Nadel’s article from yesterday on the Income Builder Portfolio that he has built and manages using monthly contributions from this site’s founder, Greg Patrick.
2022’s Dividends Grew 10.4% Over 2021’s
Here is the annual dividend growth in the DGP over the last five years.
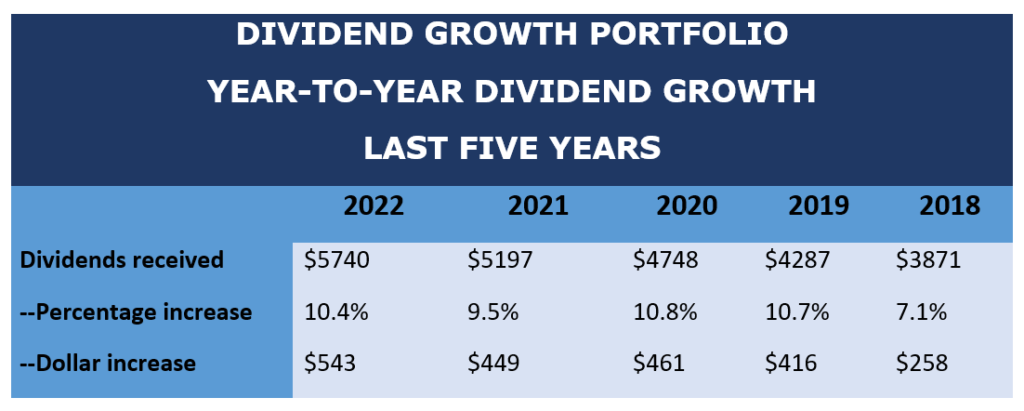 You can see that in 2022 I collected $5740, which was a 10.4% increase over 2021. Measured in dollars, the increase was +$543 compared to the year before.
In this table, you can also see the compounding effect discussed in the previous section. The percentage increase each year is relatively the same, around 10%+ per year, with one significant exception in 2018, when the percentage increase was only 7.1%.
You can also see that the dollar value of each year’s increase has generally risen every year. Again, there is one exception, 2021, where the dollar increase was a bit smaller than the year before. That’s because the percentage dropped from +10.8% in 2020 to +9.5% in 2021. That was probably due to companies shrinking their increases as Covid threw shade over expected earnings growth.
Here’s another way to look at the annual dividends received each year since the portfolio’s inception:
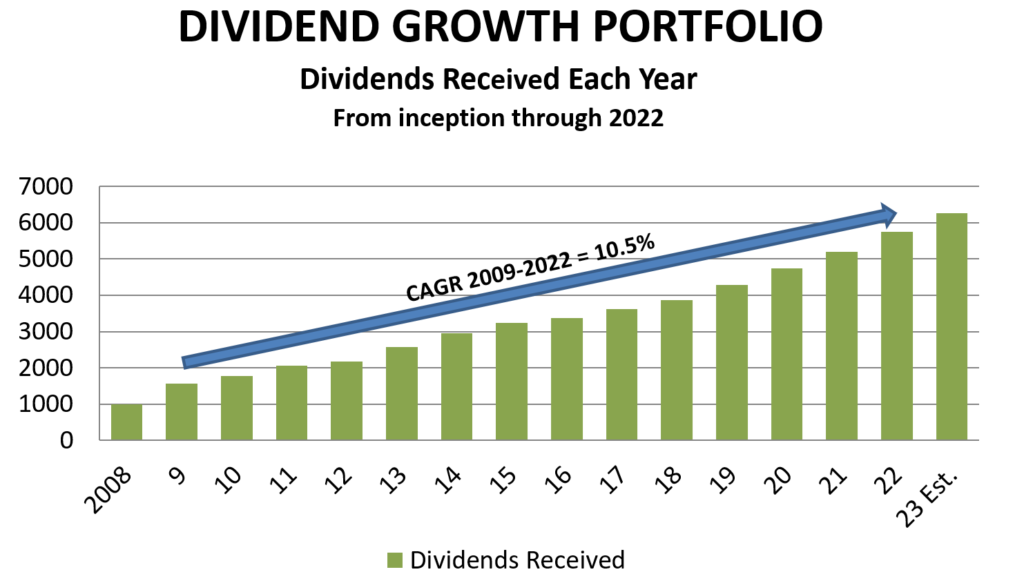 This is my favorite chart, because it illustrates so well how dividend-growth investing works.
The chart illustrates several things:
- How every year’s dividends received is larger than the year before. Note that 2008 was a partial year (inception date was June 1, 2008).
- The compound annual growth rate of dividends from the first full year (2009) through the end of 2022 has been 10.5% per year.
- I can make a logical, conservative estimate for 2023. I plugged in a 9% increase for the year. I will update the estimate from time to time as real data comes in during the year.
Earlier, we saw that the current dividend run-rate for the portfolio is $6160. If nothing at all changes, and $6160 becomes the actual year-end total, that would result in a 7.3% increase in 2023 all by itself.
Of course, in the real world, that run-rate will increase as the year goes on. Between dividend increases and my reinvestment of dividends, I expect the actual growth will be around 10%-11% in 2023. That’s why I think my 9% SWAG is conservative.
Why do dividends grow so predictably in a DG portfolio? It’s not complicated, as shown next.
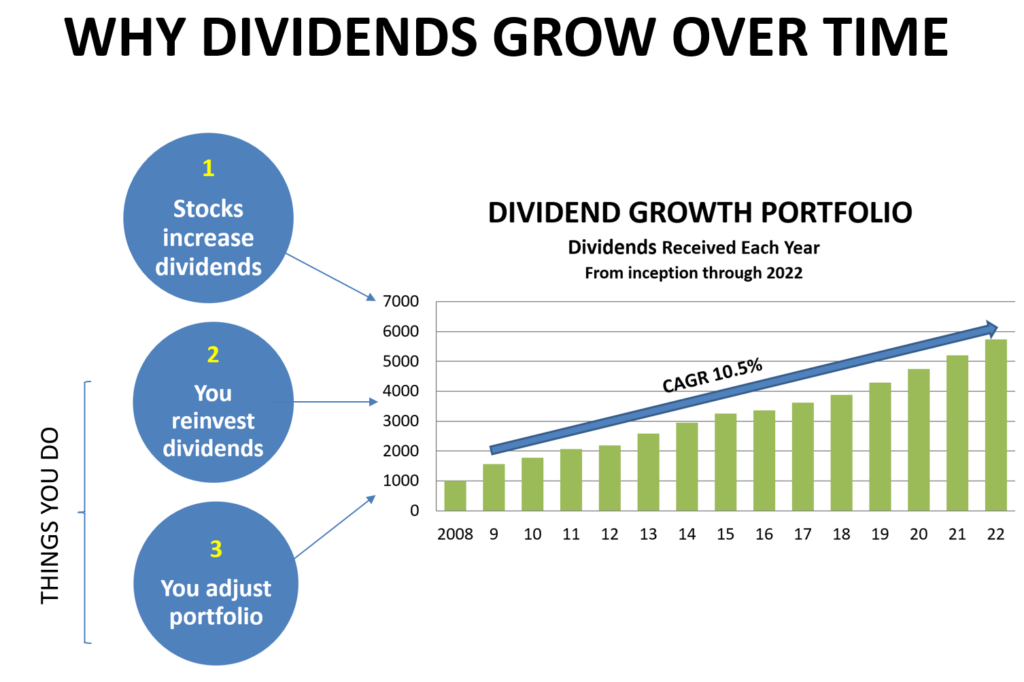
- Companies increase their dividends. Of course, I select stocks for their propensity to raise their dividends every year. Just for a couple of examples, I own Johnson & Johnson (JNJ), which has a 59-year streak of raising its dividend every year, and Microsoft (MSFT), which has done it for 12 straight years. I don’t buy any stock unless it has already established a 5-year streak.
- You reinvest the dividends. As dividends come in, the investor can turn right around and buy more shares with them. In the DGP, I do that monthly, hand-picking the stock that I want to add to, or even a new stock. Of course, if you need the dividend income to pay your bills, you don’t reinvest all (or maybe any) of the dividends.
- You adjust the portfolio. From time to time, you might decide to make changes to the portfolio – jettison a stock that is not living up to expectations, balance the positions, move money from an overvalued company to one that’s a better bargain, and so on.
I have charts showing each of these three reasons for income increases in the DGP in 2022, but to keep this discussion simple, I will just display one of them. The following table illustrates the first factor: Dividend increases by the companies.
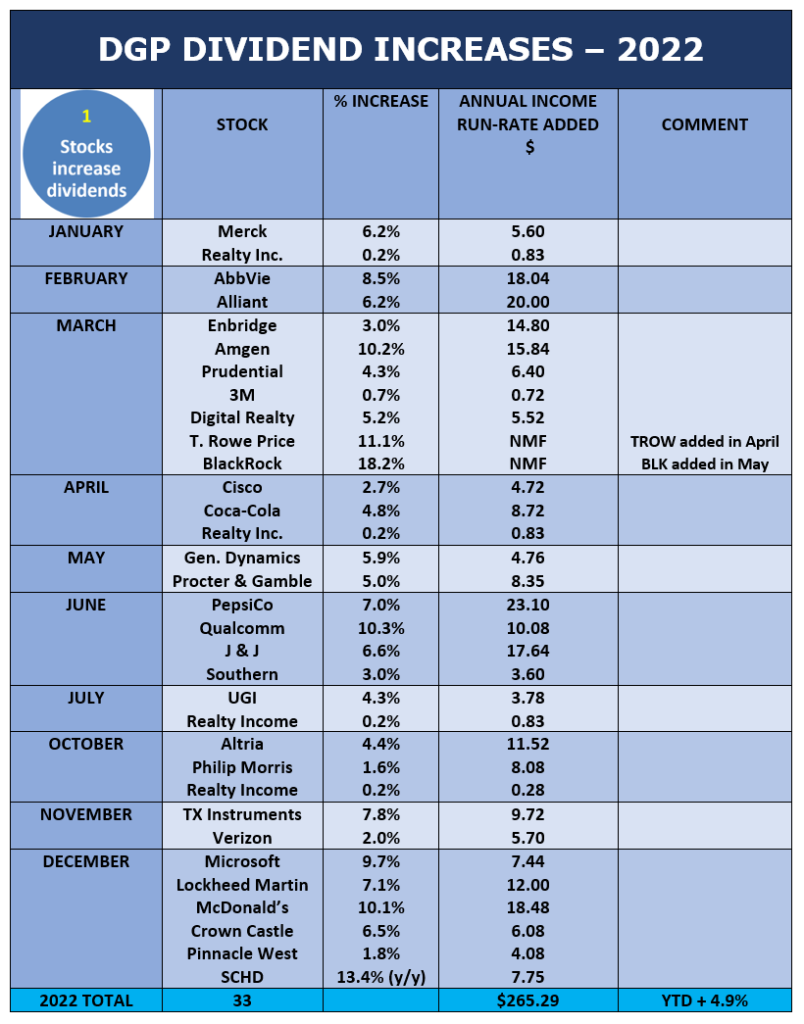 As you can see, in 2022, my holdings delivered 33 increases. Some were big, some were tiny. But in total, they added 4.9% to the annual dividend run-rate of the portfolio. All of that growth is organic, meaning that it comes from within the portfolio and requires no action on my part. The companies do it themselves. The market has nothing to do with dividends either.
The third column shows the annual dividend run-rate, not dividends collected. There is a distinction, because when a company increases its dividend late in the year, some of its dividends for that year were already paid at the prior rate.
As a result, the dividend run-rate is a forward-looking metric. It shows the speed at which dividends are coming in right now (and expected in the future) rather than how many dollars have been collected over the prior 12 months. In a portfolio with rising dividends, the current run-rate is always larger than the dividends collected over the prior 12 months.
This table shows how the DGP’s run-rate has changed over the last five calendar years. The figure for each year is the run-rate at the end of the year.
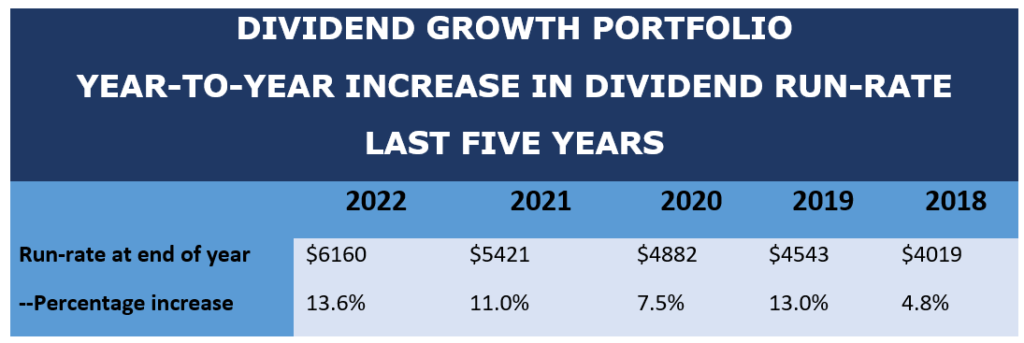 So using 2022 as an example, the DGP’s collected dividends were $5740, while the run-rate at the end of the year is $6160 per year. The two metrics provide slightly different perspectives on the underlying beauty of a well-functioning DG portfolio: The income rises every year.
Total Performance Beat S&P 500 by 15.6% in 2022
I mentioned at the beginning that the DGP has two objectives. The first and primary objective is to generate growing income, as we have been discussing.
The secondary goal, from the portfolio’s Business Plan, is:
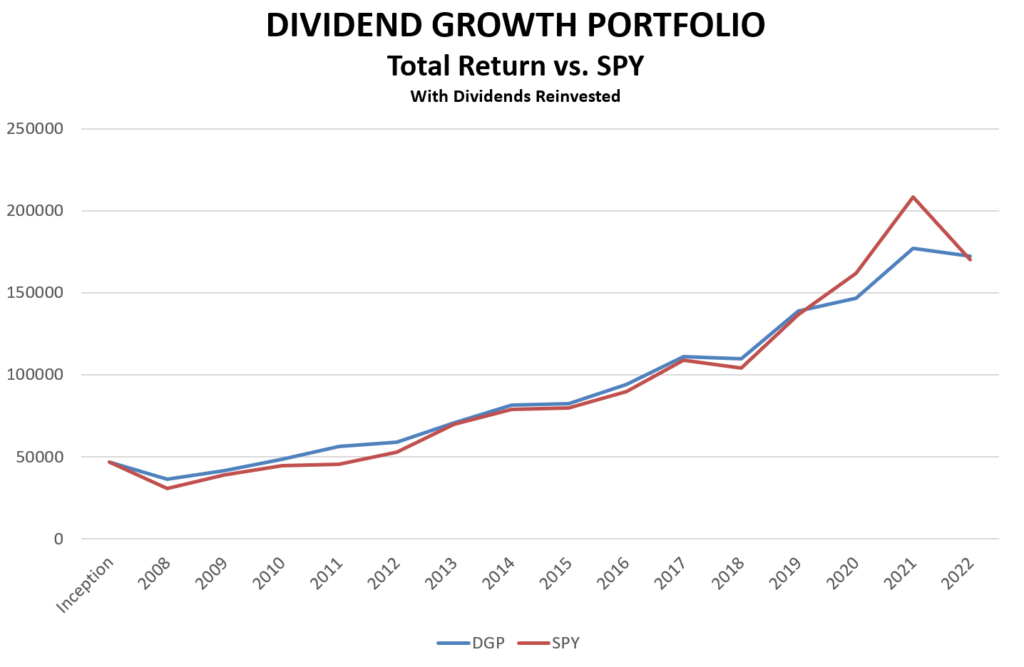
Deliver total returns that are competitive with the general stock market as measured by the S&P 500 with dividends reinvested.
Here is how that has gone since inception:
 (Source of SPY’s returns: ETF Replay)
SPY is the largest ETF that tracks the S&P 500. I figure its total returns with dividends reinvested back into itself, because I reinvest my dividends in the DGP (albeit into stocks that I choose each month).
As you can see, the DGP and the hypothetical investment in SPY have pretty much tracked each other most years. In 2020, the S&P 500 took a big lead coming out of the brief Covid crash, as large-cap technology stocks and their ilk basically took over and dominated the S&P 500. That trend continued in 2021.
But those kinds of “headline” stocks reversed course in 2022, while my DGI stocks fell much less. At the end of the year, my portfolio ended up slightly ahead again.
- DGP value = $172,329 (+268% since inception)
- SPY value = $170,290 (+264% since same date)
Many commenters and pundits criticize dividend-growth investing, because they say “It just can’t keep up with ‘growth’ investing,” or “Companies only pay dividends because they can’t think of anything else to do with the money,” implying that they have no avenues for growth.
But my experience is that companies with robust dividend-growth policies are often best-of-breed, and that paying dividends actually helps them focus on the best projects for reinvesting the profits that they do retain. In other words, they grow too, and in a DG portfolio, the combined effect of company growth plus reinvesting the dividends to buy more shares may mean that the value of your stocks overall will grow just as fast over the long term as “growth” indexes.
And the valuations of DG stocks don’t tend to get way out of line as many trendy companies do. As a result, when there’s a market reversion, like in 2022, DG company prices tend not to fall as much or as fast as companies like Amazon (AMZN, -50% in 2022), Alphabet (GOOGL, -39%), Facebook (META, -64%), and Tesla (TSLA, -65%).
In 2022, again measured with dividends reinvested, SPY fell 18.4%. My portfolio fell just 2.8%.
All results in the DGP have been achieved without any new outside contributions since the portfolio kicked off in 2008. No additional money has ever been added to the DGP since it began.
As I’ve mentioned, sheer wealth is a secondary goal of the DGP, with the primary goal being to generate reliable growing dividends. The distinction between wealth and income objectives is important for several reasons:
- The income objective leads to a smoother ride. Dividends rarely go down, whereas prices go up and down all the time. While my portfolio’s total value fell by 2.8% in 2022, its income rose 10.4%. Dividends are independent from the market: The market determines prices, but the companies themselves declare the dividends.
- The income objective influences the securities to select. I look for stocks of excellent companies with good dividend track records, because they are likely to continue raising their dividends.
- Portfolio management is simplified. With dividends being far more reliable than prices, there are fewer temptations to sell when prices are falling. In fact, weak prices become a reason to buy if you believe in the soundness and future prospects of the company over the long term.
The Portfolio as 2023 Begins
Here is my portfolio as of the beginning of the year:
 Looking Ahead to 2023
 Looking Ahead to 2023
Before previewing 2023, let’s look at the most important changes to the DGP in 2022:
- I made 12 monthly dividend reinvestments totaling about $5700.
- The number of positions fell from 31 to 29, as I sold out of five stocks and added three new ones. Stocks sold out: Chevron (CVX), 3M (MMM), Smucker (SJM), Lowe’s (LOW), and General Dynamics (GD. New positions added: Crown Castle (CCI), T. Rowe Price (TROW), and BlackRock (BLK).
- The portfolio’s cash income grew 10.4% to $5740. And in parallel to that, the DGP’s Yield on Cost rose to 13.2%.
- The portfolio’s total value fell 2.8% to $172,329, outperforming SPY’s loss of 18.4%. Over its lifetime, the DGP’s value has risen 268% without the addition of any new money along the way.
As we enter 2023, the DGP is 14 years, 7 months old.
Here is what I anticipate in 2023. I don’t make market predictions, rather I focus on what I can control. Here are my predictions for the new year.
- Prediction: The portfolio’s dividend income will top $6200 for the first time in 2023, and its run-rate will surpass 14% yield on cost.
- Prediction: I will continue to focus on the portfolio’s smallest positions –as I did in 2022 – and decide whether to jettison a couple more while building up the ones in which I have the most confidence. I define “small position” as one that is less than 3% of the portfolio.
- Prediction: I will consider whether to strive for a more balanced portfolio. Currently, position sizes range from less than 1% to more than 6%. I may lower the maximum position size from its current 8% to 6% or even 5%. When the portfolio started, the maximum allowable size was 20%. I have lowered the maximum over the years to 15%, 10%, and currently 8%.
- Prediction: Time permitting, I want to study SCHD’s rebalancing procedures. SCHD is, in my opinion, the top dividend-growth ETF available. Part of its success, I believe, is due to its periodic rebalancing. They don’t go to equal weights, but they come closer to equal weights than I currently have. I want to understand better the pros and cons of their approach.
- No prediction: As usual, I make no prediction about total return. I believe that over time, total return comes along nicely in a dividend-growth portfolio, but I make no effort to predict it year-to-year. The market will do whatever it does in the short term. Long-term, I’ll be fine.
Thanks for reading! Please continue to follow the DGP’s progress via my monthly updates. In addition to those, I’ll write an article every time I buy or sell anything; you’ll see those articles in Daily Trade Alert’s and Dividends & Income’s newsletters and on their home pages.
To all my fellow investors: Have a happy, healthy, and prosperous 2023!
— Dave Van Knapp
Motley Fool Stock Advisor's average stock pick is up over 350%*, beating the market by an incredible 4-1 margin. Here’s what you get if you join up with us today: Two new stock recommendations each month. A short list of Best Buys Now. Stocks we feel present the most timely buying opportunity, so you know what to focus on today. There's so much more, including a membership-fee-back guarantee. New members can join today for only $99/year.
Source: Dividends & Income