November’s Dividend Reinvestment: Verizon Communications (VZ)
All year, I have been focusing on my smallest positions: Deciding which ones to keep, building those up, and discarding a couple that I don’t want any more.
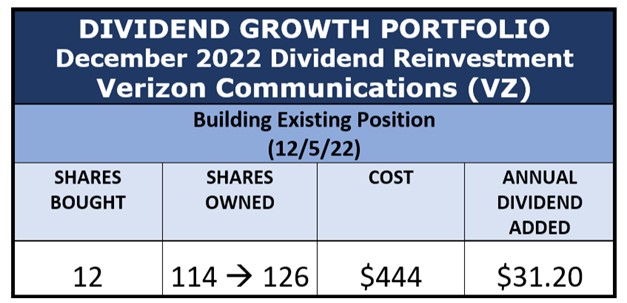
For my December reinvestment, I decided to add shares to a small position that I have built slowly since first buying shares in 2018: Verizon Communications (VZ). Before this month’s purchase, Verizon comprised 2.5% of my portfolio.
Verizon is one of those companies that most of us take for granted. I know that I take it for granted. It is for my wife’s and my cellphone provider.
Verizon has two reportable segments.
- Verizon Consumer Group provides wireless and wireline communications services, with wireless being the much larger contributor to financial results. Its dwindling wireline services are provided in nine states and D.C. over a fiber-optic network (Fios) plus a traditional copper-based network.
- Verizon Business Group provides wireless and wireline communications services and products, including voice, data, video, conferencing, and security as well as network access to support the vast and growing Internet of Things (IOT).
Somewhat like last month’s investment in Crown Castle (CCI), this investment is a play on the breathtaking growth of electronic data in all of its forms.
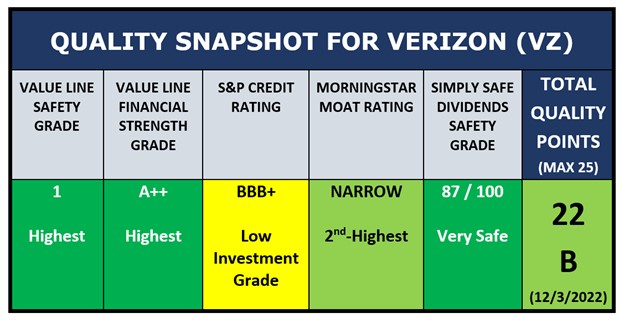 Verizon’s Quality Snapshot is very good, highlighted by its top grades for Value Line Safety and Financial Strength, as well as its very high grade from Simply Safe Dividends for Dividend Safety. Its only non-green grade is its BBB+ credit rating, which is nevertheless an investment-grade rating by S&P.
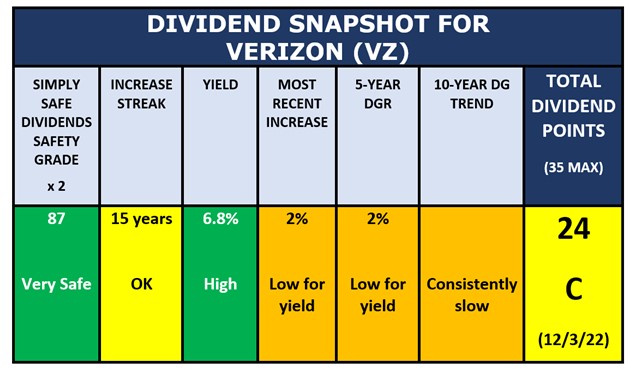 Verizon’s Dividend Snapshot illustrates clearly the company’s investment proposition: High yield, slow growth, and strong dividend safety. The total score of 24 / 35 makes it investable in my book.
I use the high dividends from a company like Verizon to reinvest in other companies with yields in the 3-4% range and faster dividend growth.
Here’s a look at at Verizon’s price and valuation:
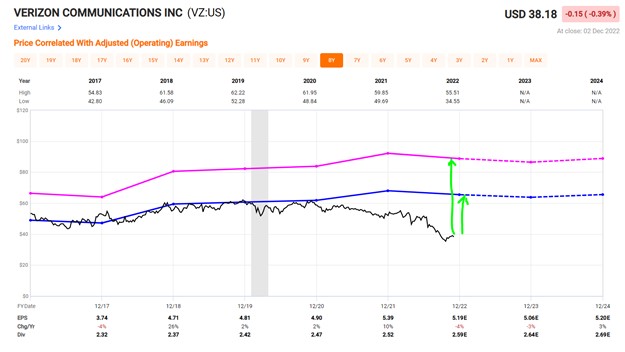 Verizon is one of my colleague Matthew DiLallo’s Three Beaten-Down Dividend Stocks that Look Like Bargains profiled in a recent article. As you can see from the FAST Graph, Verizon’s price (black line) has been falling slowly but steadily over the past couple of years.
That steady decline has resulted in significant undervaluation when compared to the two fair price reference lines on the graph: The pink line represents the average P/E ratio of companies in the Communications segment, while the blue line represents Verizon’s own average P/E ratio for the preceding five years. Verizon’s current price is well below both of those valuation estimates.
I also applied two other valuation models to Verizon, and when I was done, here is what I got:
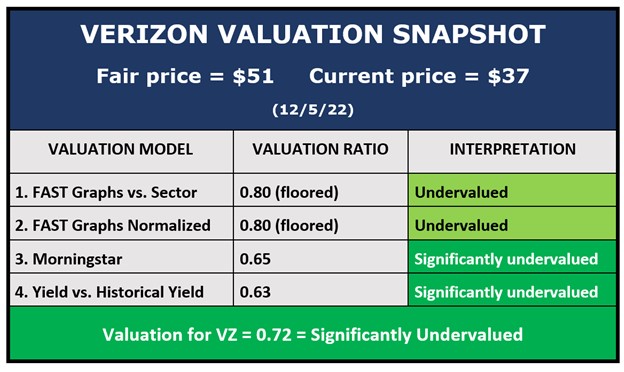 Even after cutting off the first two models as potentially overstating Verizon’s degree of undervaluation, I still get a fair price for Verizon of $51 per share. Its actual price of about $37 is 28% undervalued.
Therefore, I went ahead on December 5 and made this month’s regular dividend reinvestment: I purchased 12 shares of Verizon.
 The new shares push Verizon up to 2.7% of the account. That’s still a small position, being under 3%, but it’s getting close to leaving that category. If its price starts to revert to fair value, it will leave the category.
Verizon just raised its dividend a bit in November, so all 126 shares qualify for the new rate. The next ex-dividend date is January 9, and the next payout should be February 1.
Portfolio News and Review
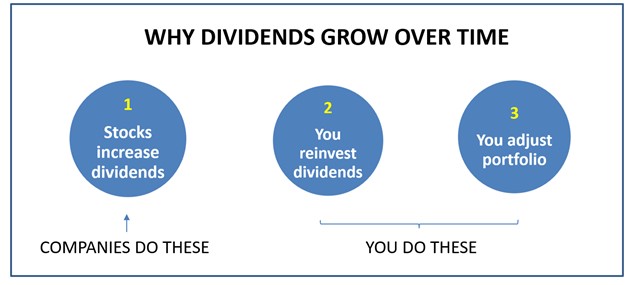 This illustration shows the three reasons that dividends grow in a dividend-growth portfolio.
- Dividend increases. The companies in the portfolio announce regular raises.
- Dividend reinvestments. I reinvest the dividends to add new shares, which produce more dividends.
- Portfolio management. I occasionally make trims and replacements that result in dividend growth.
Reason #1 is in the companies’ control. You have nothing to do with it, other than to select the right companies in the first place.
Reasons #2 and #3 are the result of actions that you, the investor, take. This month’s purchase of Verizon with dividends collected from companies in the portfolio is an example of #2.
Here’s how those reinvestments add up.
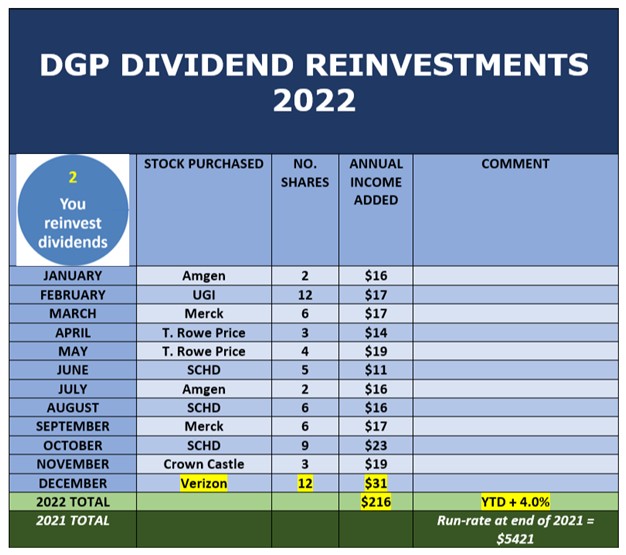 At the end of last year, the DGP’s dividend run-rate was $5421 per year. My monthly reinvestments have addded 4.0% to that run-rate all by themselves in 2022.
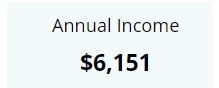
The run-rate has also been pushed up by the other two reasons – dividend increases and portfolio trades. I track the portfolio at Simply Safe Dividends, and this is the annual dividend run-rate after the Verizon purchase:
 So overall, the DGP’s dividend run-rate has grown 13.5% in 2022.
Inflation has been in the news all year, and the most recent TTM (trailing 12-month) inflation rate announced by the Bureau of Labor Statistics was 7.75%. (Source) You can see that the growth in the DGP’s income in 2022 has nearly doubled that inflation rate.
That brings me to my favorite chart for this portfolio.
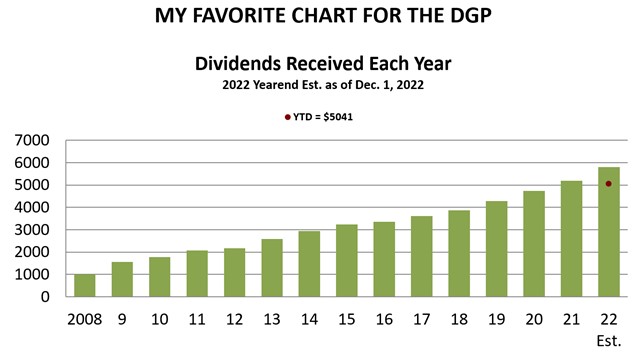 That chart – showing the annual growth in dividends collected – leads me to the next one.
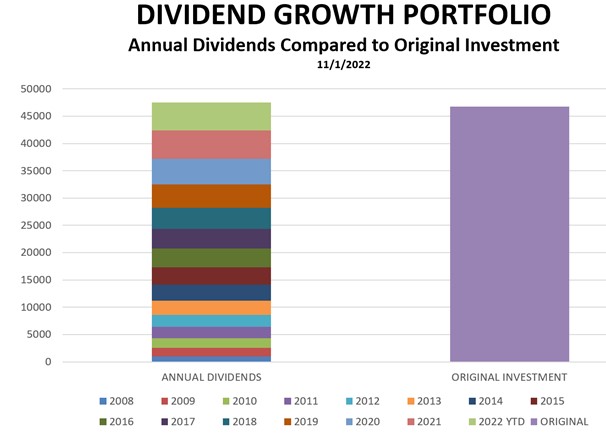 In this chart, the annual totals shown by the green bars in My Favorite Chart are shown as stacked layers in the left-hand bar. The bar on the right shows the amount of money I invested originally to start the portfolio in 2008.
What this chart demonstrates is that the portfolio has now collected more in dividends than it cost to start the portfolio in 2008.
If you look close, each layer in the left bar – representing a year’s worth of dividends – is taller than the one beneath it, because the dividend stream has grown every year.
The portfolio has averaged 10.5% compound annual growth in the dividend stream each year, and it looks like that number will be achieved again this year.
And finally, because compounding speeds things up over time, it will not take another 14 years to duplicate the original investment again. Per the CAGR (compound annual growth rate) calculator at moneychimp, at 10% per year CAGR, it will only take about half as long to reproduce the original investment again.
All of these numbers help illustrate success in meeting the main goal of this portfolio, as stated in its Business Plan:
Build a reliable, steadily increasing stream of dividends over many years that can eventually be used as income for retirement.
That goal has been hit every year of the portfolio’s existence, and the main reason is the “miracle” of compound growth. Compounding means to make money on money already earned. The DGP not only earns returns on the initial investment, but it also earns returns on the growth from previous years.
The DGP’s yield on cost (YOC) is now 13.1%, which is up from 11.6% at the beginning of the year. Here’s that calculation:
YOC = Dividend Run-Rate ÷ Original Amount Invested
= $6151 ÷ $46,783
= 13.1%
YOC mirrors the dollars in the dividend stream. As they go up, YOC rises in tandem. Since I never add new outside money to the DGP, the denominator never changes in the YOC equation. In other words, all of the growth originated with my initial investment in 2008.
Yield on cost is a “scoreboard” metric, meaning that it shows how the game has gone up until now. It reflects every dividend increase and every decision I have made since I started the portfolio in 2008.
Achieving that kind of yield, starting with my modest original investment, was my aspiration in 2008. It was the reason I started the portfolio.
I hope that these real-world results are inspirational for younger investors who can visualize the possibilities of large amounts of future income that are possible to generate from modest investments today.
Yield on cost is one flavor of yield. Another flavor is current yield, which is the yield from the portfolio right now. It is the starting yield you would get if you duplicated the portfolio today at today’s prices.
Here is the calculation of current yield following this month’s reinvestment:
Current yield = Dividend run-rate ÷ Current value of portfolio
= $6151 ÷ $173,247
= 3.6%
In its 14-year history, the DGP’s current yield has ranged between 3.0% and 4.4%, swinging back and forth as dividends are increased and prices go up and down.
The current yield is about in the middle of the historical range. As a dividend-growth investor, I do not mind that the current yield swings back and forth. When it falls, it does not indicate that the income stream itself – measured in dollars – is going down. Quite to the contrary, the dollar inflow is generally always rising.
For comparison to the DGP’s 3.6% current yield, the S&P 500’s current yield is 1.7%, and the benchmark 10-year Treasury (fixed income) is 3.6%. (Source)
A secondary goal of this portfolio is total return. I want to be competitive with a simple investment in the S&P 500. I’m not trying to beat the index, as total return is not my main focus. But I like to be in the same ballpark.
As of the beginning of December, the total value of the DGP has grown +277% from its inception in June 2008. For comparison, an investment in SPY, the largest ETF that tracks the S&P 500, with dividends reinvested, would have increased 287%. (Source) The SPY investment would be yielding less than half of the DGP’s current yield. I am totally satisfied with that comparison.
If you want to see the portfolio as of November 1 (just before the Verizon purchase was made), you can always find the end-month-summary here: Dave Van Knapp’s Dividend Growth Portfolio. That page includes a complete description of the origins of this portfolio.
Remember, the DGP is not presented as best. It is not a model portfolio, nor is it tailored to growth, harvesting, or any particular age group. Rather, it is a “mainstream” dividend-growth portfolio that demonstrates in real dollars what you can accomplish with the dividend growth strategy.
I don’t suggest that anybody replicate this portfolio, but rather that you learn what you find relevant from its principles and illustrations of mechanics. I show what I do and explain why I do it.
-–Dave Van Knapp
This stock checks all the boxes. Pays a high dividend (8%), has a record of increasing that yield (an average of 37.5% throughout company history), and is set up perfectly to profit from continued Fed rate hikes. Click here for the name and ticker of the most perfect dividend stock on the market right now.
Dividend Growth Portfolio Archive
| Date | Latest Articles |
| 11/8/2022 | I Just Bought More Shares of This Stock |
| 10/6/2022 | I Just Bought More Shares of the Top-Ranked Dividend Growth Fund Schwab’s U.S. Dividend Equity ETF (SCHD) |