
So you want $5,000 per year in passive income, and you’ve decided that a dividend portfolio is the best way to go.
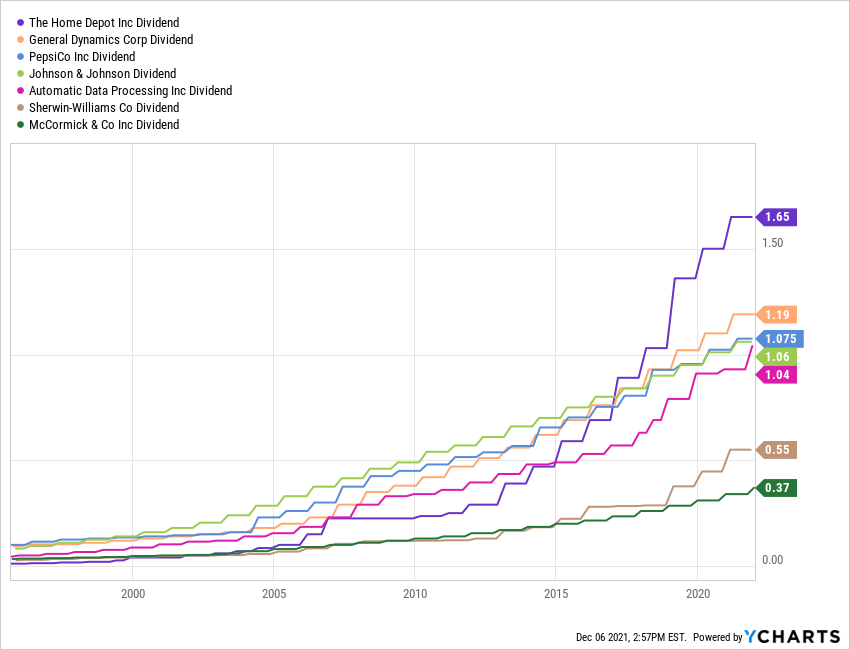
After all, dividends paid by high-quality companies are reliable. They usually grow at an inflation-beating rate year after year, too.
Unlike stock prices, which go up and down at the whims of buyers and sellers, dividends generated by blue-chip companies usually move in only one direction: UP.
With this in mind, how much money do you need to invest in order to generate $5k a year in dividends?
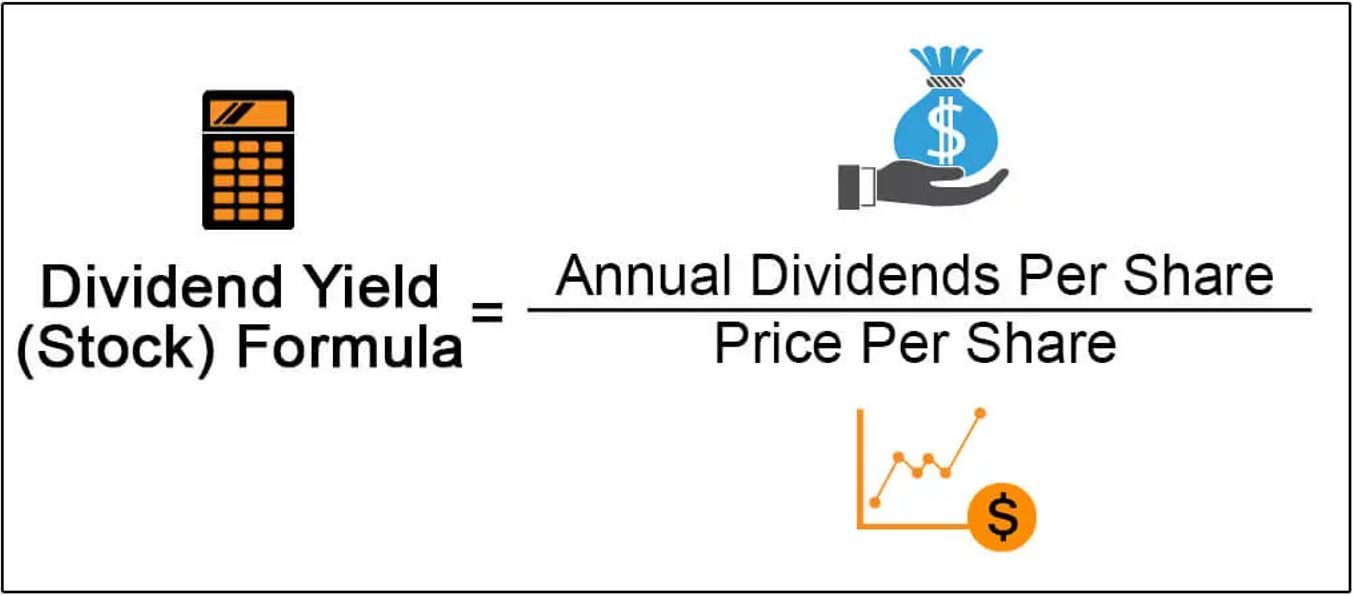
In short, that depends on your portfolio’s DIVIDEND YIELD.
A company’s yield is easy to calculate. It’s the annual dividends per share, divided by the current stock price.
MarketXLS.com
For example, Morgan Stanley (MS) pays an annual dividend of $2.80 per share. If its price is $98.21, its yield is .0285, or 2.85%.
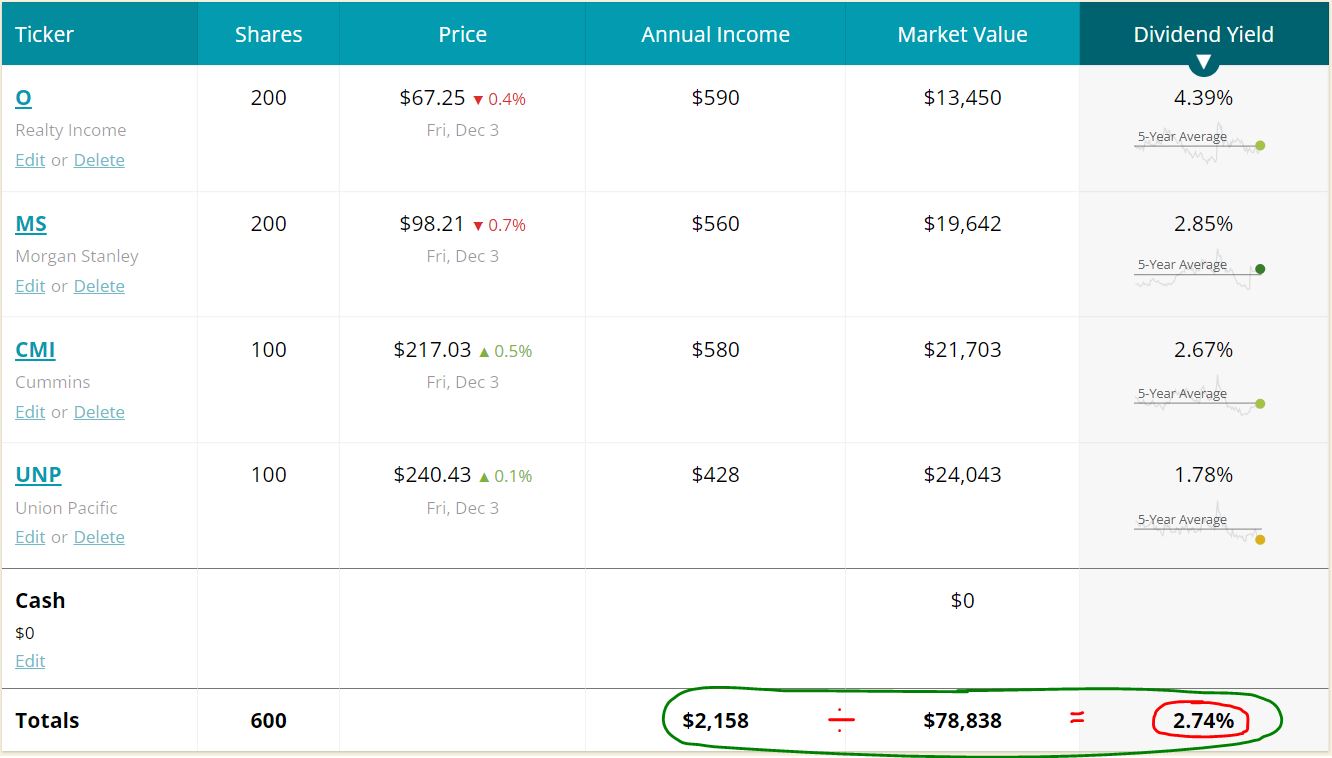
To calculate the annual yield of an entire portfolio, you add the projected annual income of all positions and divide it by the dollar value of a portfolio. In the following sample portfolio, the annual income ($2,158) is divided by the portfolio value ($78,838) to reach .02737, which is rounded up to 2.74%.
SimplySafeDividends.com
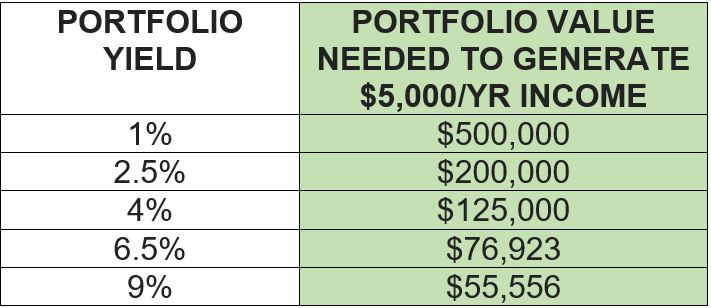
Given all that, here’s a table showing investment dollars needed to produce $5,000/year, based on various yields:
Real-World Example
To illustrate this, let’s take a look at our real-life, real-money project, the Income Builder Portfolio.
At the end of November, it had a market value of $129,975 and a projected annual income stream of $3,315 … meaning it had an overall portfolio yield of 2.55%.
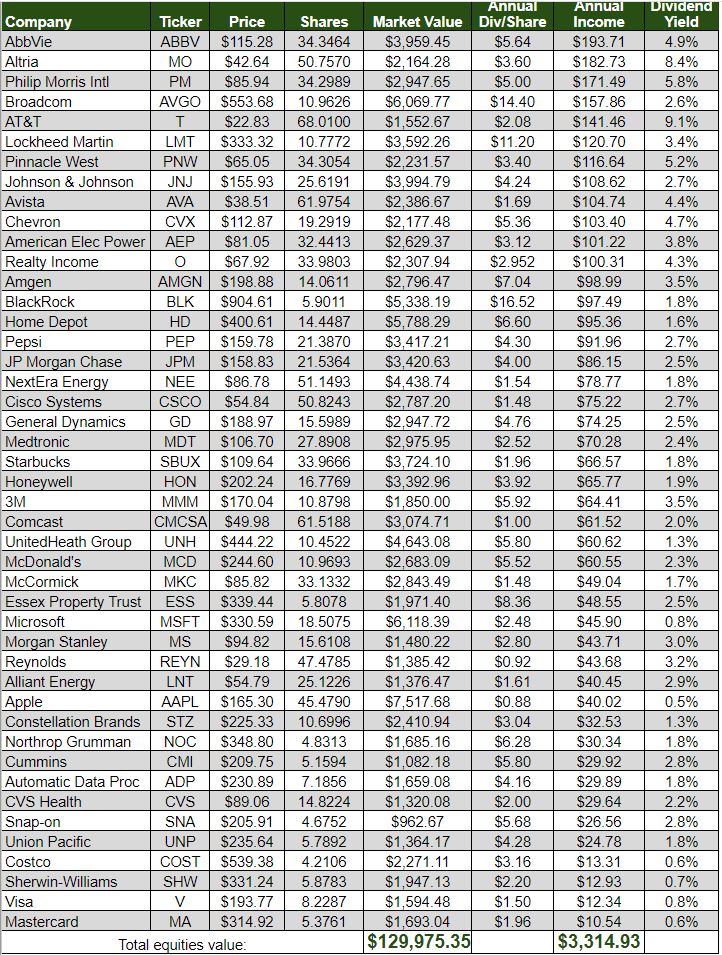
One reason I selected $5,000 for this article is that the “Income Target” for the IBP is $5,000 in projected annual income by the end of Year 7 — as outlined in the portfolio’s Business Plan.
At the start, the $5,000 figure assumed a 2.5% yield and 5% dividend growth; I played it pretty conservative because I didn’t want to have to chase yield to achieve the goal. I always wanted to emphasize quality first.
It hasn’t quite been 4 years since we launched this portfolio in January 2018, and we’re already 66% of the way to our target.
I’ll have more about the IBP in a bit, including our November transactions and dividend activity.
Scaling The Income Mountain
Obviously, you might have a higher income target than $5,000.
Although we don’t present the Income Builder Portfolio to convince fellow investors to replicate it, any portfolio is “scalable.”
In other words, if you find a combination of stocks (or mutual funds or bonds or any other investments) that you like, that portfolio could work whether your income goal is $500 or $5,000 or $50,000 or $500,000 or any other number.
Let’s say you are two years from retirement and you want $25,000 in annual dividends to augment whatever Social Security, pension or other income you receive. In that case, the numbers in the earlier $5,000 table would need to be multiplied by 5, resulting in these new dollar requirements:
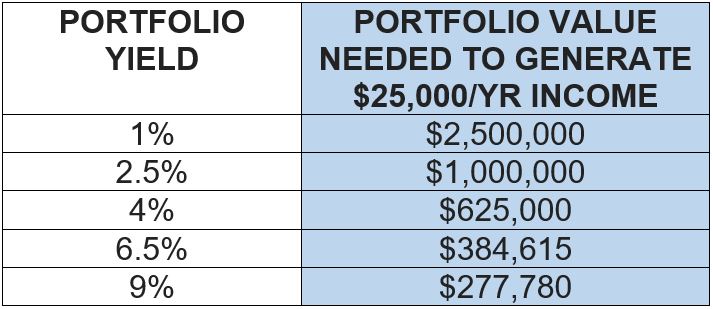
So within two years, you’d need $1 million in investments yielding 2.5% … or $625,000 in investments yielding 4% … or $384,615 in investments yielding 6.5% to generate $25,000. That might seem daunting to some, which is why we advocate saving and investing early and often.
These are simplified calculations, to be sure. They don’t include dividend growth or reinvestment, which are important parts of most passive-income strategies. Nor do they account for inflation, which was benign for more than a decade but recently has become more fierce.
There are too many variables to make a comprehensive study in just one article, so it’s up to each investor to conduct his or her own due diligence into important factors like those.
Go Big or Go Home?
Why not just load up your portfolio with stocks yielding 9% or more? That way, you don’t need to invest as much money to generate the passive income you want, right?
Well, in general, higher-yielding stocks tend to be more volatile and/or risky. I agree with the folks at Investopedia, who say:
- A high dividend yield might indicate a business in distress. The yield could be high because the company’s shares have fallen in response to financial troubles, and the struggling company hasn’t cut its dividend yet.
- Investors should scrutinize a company’s ability to pay consistent dividends, which includes examining its free cash flow, historical dividend payout ratio and other metrics of financial health.
Again, quality is my first, second and third concern, Then I’ll think about yield.
Of course, “quality” is subjective. To try to make it a little more objective, my colleague Dave Van Knapp has developed “Quality Snapshots” — a simple system that assigns 1-5 points for each of five grades provided by respected agencies and investing services. Here’s one Dave did for Johnson & Johnson (JNJ):
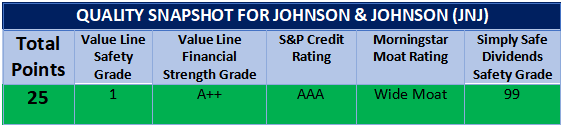
JNJ got the top mark in every box, for a perfect score of 25. No wonder it’s found in so many income-oriented portfolios, including the IBP. Read Dave’s article on this subject HERE.
Busy Month for the IBP
November was an eventful month for the Income Builder Portfolio.
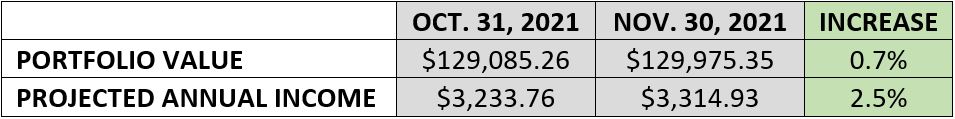
The IBP’s value increased 0.7%, but only because about $2,000 in new money – as allocated every month by this site’s co-founder, Greg Patrick – was used to purchase stocks on Nov. 8 and Nov. 22. (More on the buys later.)
That mediocre performance wasn’t surprising, given that the S&P 500 Index was down nearly 0.8% for the month.
Nevertheless, the IBP’s projected annual income stream increased a robust 2.5% — demonstrating a point I made earlier in the article: While stock prices can experience significant swings, a dividend stream produced by high-quality companies pretty much only flows up.
The portfolio’s income growth was achieved through a variety of factors, as illustrated by the four sections in the table below:
- Companies that announced dividend increases.
- Positions that received and reinvested dividends.
- Holdings that increased in size through share purchases.
- Corporate activity.
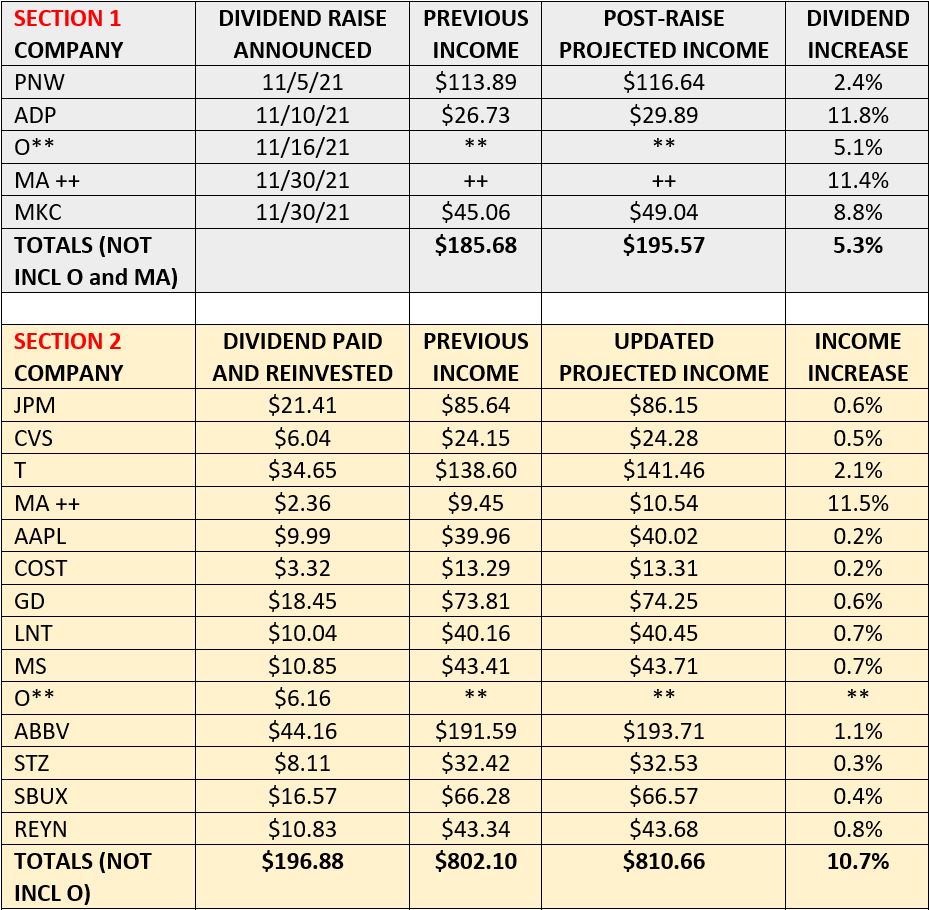
** O experienced activity in all four sections; its total activity is reflected in Section 4 … ++ MA saw activity in sections 1 and 2; its total is reflected in Section 2
The IBP’s most active position in November — by far — was Realty Income (O), a real estate investment trust with a strong commitment to growing its monthly dividend.
I’ll get to O in a minute. First, a few other highlights from that table …
SECTION 1
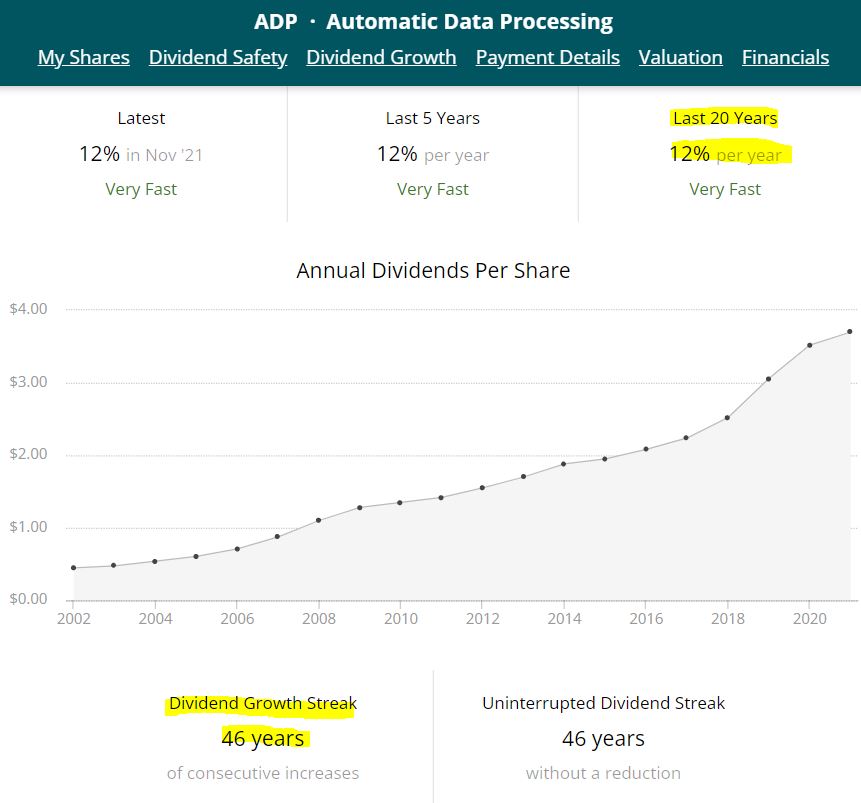
Automatic Data Processing (ADP) delivered the month’s highest dividend raise, 11.8%, making up for an unusually small hike (2.2%) last year. The workplace administration management company has been a tremendous dividend grower for decades.
SimplySafeDividends.com
Pinnacle West Capital (PNW) scared away investors when it reported that Arizona regulators would reduce the utility’s profitability in the near term.
There was concern that the company would have to cut its generous dividend. So it was a pleasant surprise — and even a bit of a relief — that Pinnacle instead came through with a small raise that sent its yield past the 5% mark.
PNW’s stock price had plummeted, but it since has started to recover.
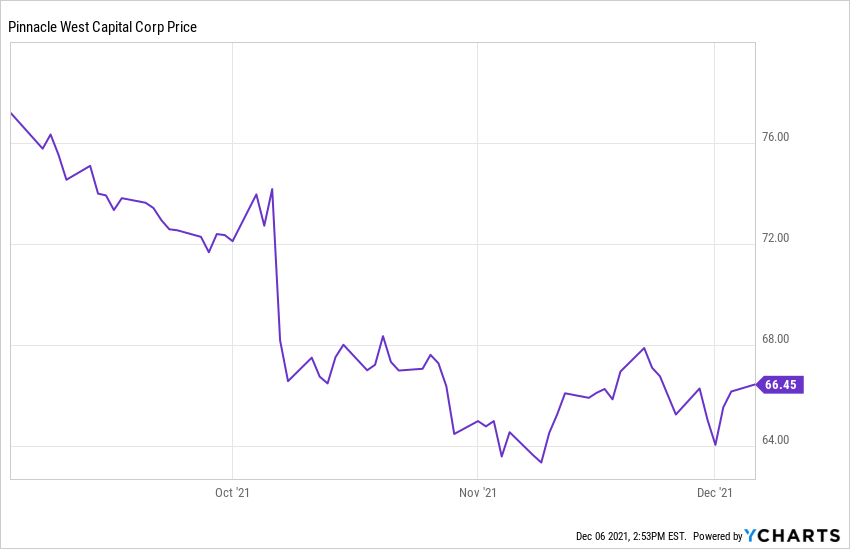
The dividend increase sent a signal that management believes in the company’s stability — and that’s also reflected in the good grades Pinnacle gets from Value Line for financial strength (A) and relative safety (2).
SECTION 2
Investor-friendly drugmaker AbbVie (ABBV) just keeps chugging along. A month after announcing its 49th consecutive annual dividend hike (dating back to its years as part of Abbott Labs), it sent $44 into the IBP, which I happily reinvested back into another chunk of the stock.
AbbVie is the portfolio’s No. 1 income producer, and it’s expected to generate almost $200 over the next year.
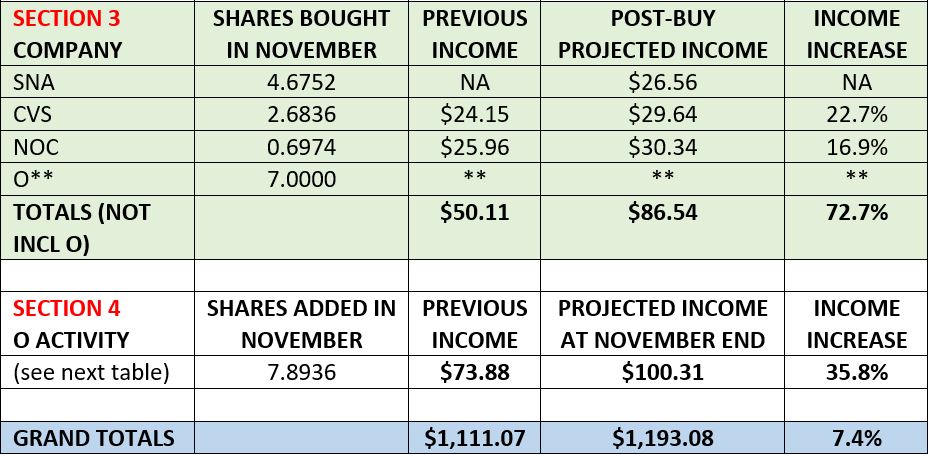
SECTION 3
On Nov. 8, we used Greg’s $1,000 semi-monthly allocation to initiate a position in Snap-on (SNA).
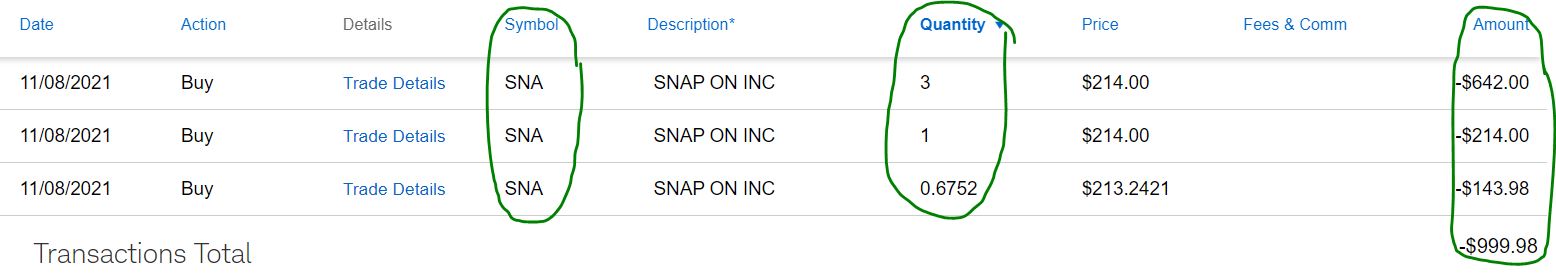
That buy came just a few days after the commercial tool company announced a 15.4% dividend raise — a typically wonderful increase for Snap-on, which has boosted its dividend by more than 300% over the last decade.
O … What a Dividend Machine!
All right, now let’s get back to Realty Income, which has centered its entire marketing campaign around its 12-times-a-year payments to shareholders.
![]()
November started with the company finalizing its $11 billion acquisition of competitor VEREIT on the month’s very first day; two weeks later, all sorts of O-related activity began within the IBP.
On Nov. 15, the $6.16 dividend was reinvested, buying an additional .0867 of a share. Also that day, I sold the 2 shares of Orion Office REIT (ONL) that the IBP had received as part of Realty Income’s spin-off of some office properties into a separate REIT; I used the proceeds to buy another .6233 share of O. (I simply felt the quality of Orion’s holdings wasn’t up to Realty Income’s standards.)
On Nov. 22, in addition to executing a purchase order for 7 shares of Realty Income stock, I bought another .1836 share with $13 in cash the IBP received in conjunction with the spin-off.
And in between all of those transactions, on Nov. 16, the company announced a 5.1% year-over-year dividend hike — marking its 96th consecutive quarterly raise.
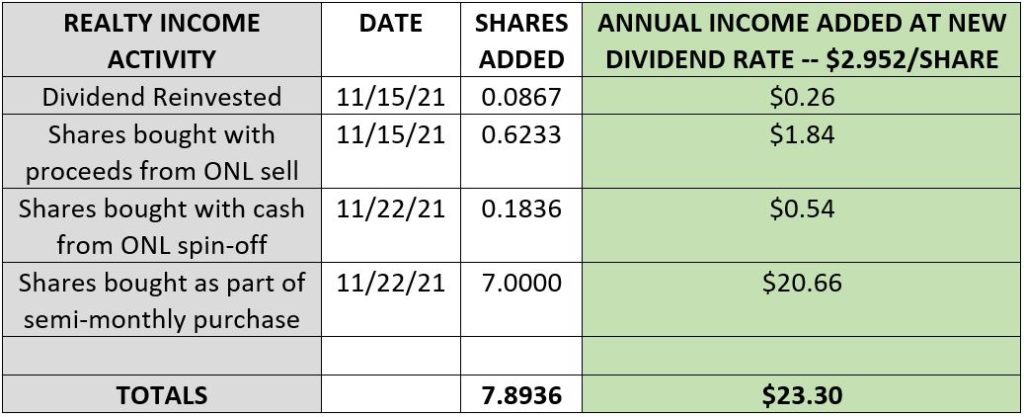
As a result of all that activity, almost 8 more shares of Income Realty came into the IBP. Our O stake went from about 26 shares at the end of October to roughly 34 shares at the end of November … and the projected annual income to be generated by the position rose from about $74 to just over $100 — a 36% increase.
On Nov. 22, in addition to the roughly $500 Realty Income buy, we added to the IBP’s positions in health-care conglomerate CVS Health (CVS) and defense contractor Northrop Grumman (NOC).
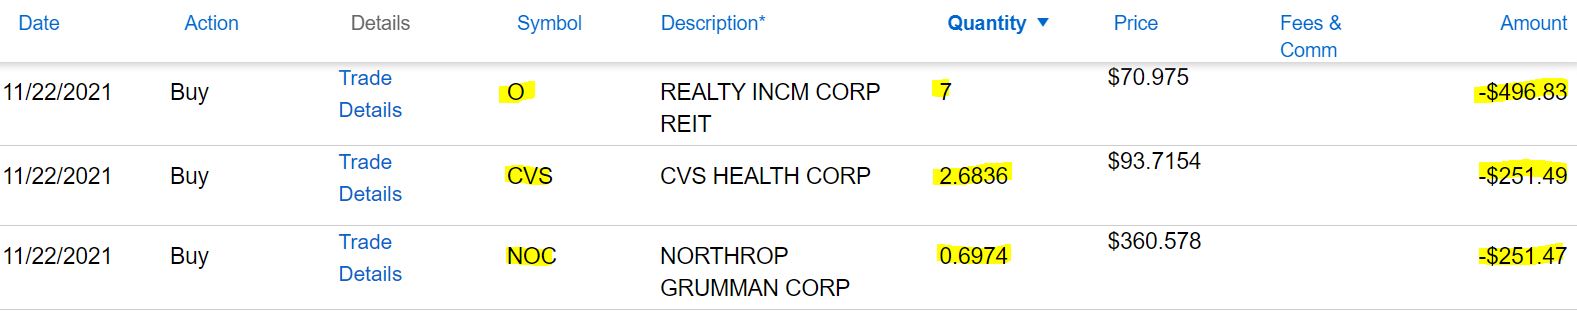
I’m always looking for opportunities to build up smaller IBP positions such as CVS and Northrop, even if it’s just $250 or so at a time.
Such little purchases might seem inconsequential in the moment … but over time they do add up, helping patient and diligent investors eventually reach their goals.
Wrapping Things Up
In addition to writing articles, I regularly make videos for our Dividends & Income Channel on YouTube.
Read about the Snap-on buy HERE; see the video HERE.
Our article about the Realty Income, CVS and Northrop Grumman purchases is HERE; see the video HERE.
The Income Builder Portfolio home page includes the regularly updated table of stocks, as well as links to all of my IBP-related articles; check it out HERE.
As always, investors are strongly encouraged to do thorough research before making any buys or sells.
— Mike Nadel
The goal? To build a reliable, growing income stream by making regular investments in high-quality dividend-paying companies. Click here to access our Income Builder Portfolio and see what we’re buying this month.
Source: DividendsAndIncome.com