Today we’ll walk you through a trade idea with Robinhood Markets Inc. (NASDAQ: HOOD) that could deliver up to 42% returns in the next 3-6 months.
Robinhood Markets, Inc. operates a financial services platform in the United States. Its platform allows users to invest in stocks, exchange-traded funds (ETFs), options, gold, and cryptocurrencies.
The company also offers various learning and education solutions comprised of Snacks; Learn; and custom watchlists. The company’s Newsfeeds offer access to free premium news from various sites, such as Barron’s, Reuters, and The Wall Street Journal.
Analyst Ratings
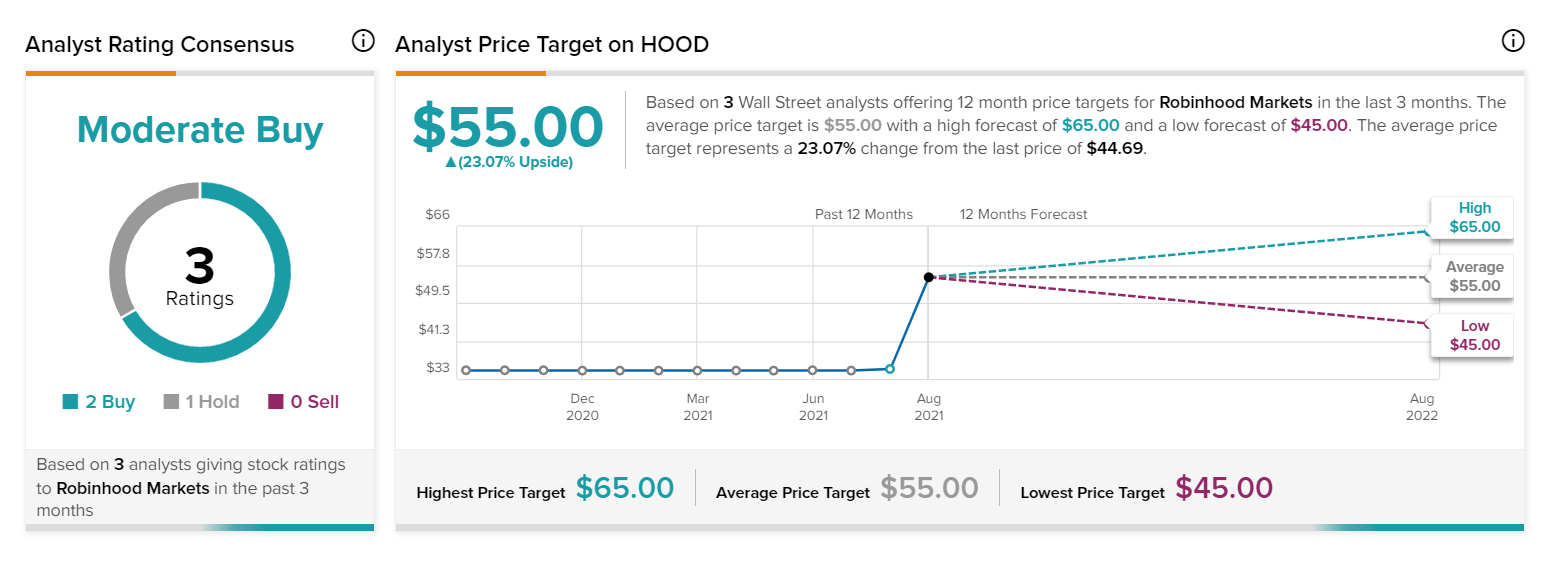
According to TipRanks, three analysts are offering 12-month price targets for HOOD in the last 3 months. Two of those analysts rate it a buy, one has a hold rating and none have a sell rating. The average price target offered by these analysts is $55.00, which represents a 23.07% change from the last price of $44.69.
Why HOOD is trending?
Robinhood had exponential growth over the past year, with revenue surging by 131% year over year to $565 million and assets under custody soaring by 205% to $102 billion. The online brokerage’s monthly active users also jumped 109% to 21.3 million. Robinhood’s growth earlier this year was fueled by the meme-stock frenzy and the rising popularity of cryptocurrencies like Dogecoin.
On Thursday, the company released its second-quarter financial results and the numbers were good. Earnings per share (EPS) came in ahead of analyst expectations at $0.11 versus $0.08. Revenue was also ahead of forecasts, coming in at $565 million versus the $531 million estimates. Monthly active users also more than doubled from 10.2 million in Q2 2020 to 21.3 million.
Despite these good numbers, HOOD’s stock prices slid by more than 10%, because of the company’s announcement to shareholders that the September quarter was unlikely to match the June quarter’s record levels of activity. The company told investors to expect “lower revenues and considerably fewer new funded accounts” in the third quarter.
It may be noted that the trend of meme-stock frenzy and crypto popularity is now slowly abating. This is expected to impact the overall userbase of Robinhood.
The company reported, “For the three months ended September 30, 2021, we expect seasonal headwinds and lower trading activity across the industry to result in lower revenue and considerably fewer new funded accounts than in the prior quarter.”
The company’s net loss for the second quarter of 2021 was $502 million or $2.16 per diluted share, compared with net income of $58 million, or $0.09 per diluted share in the second quarter of 2020. This also seems to have fueled the selling spree.
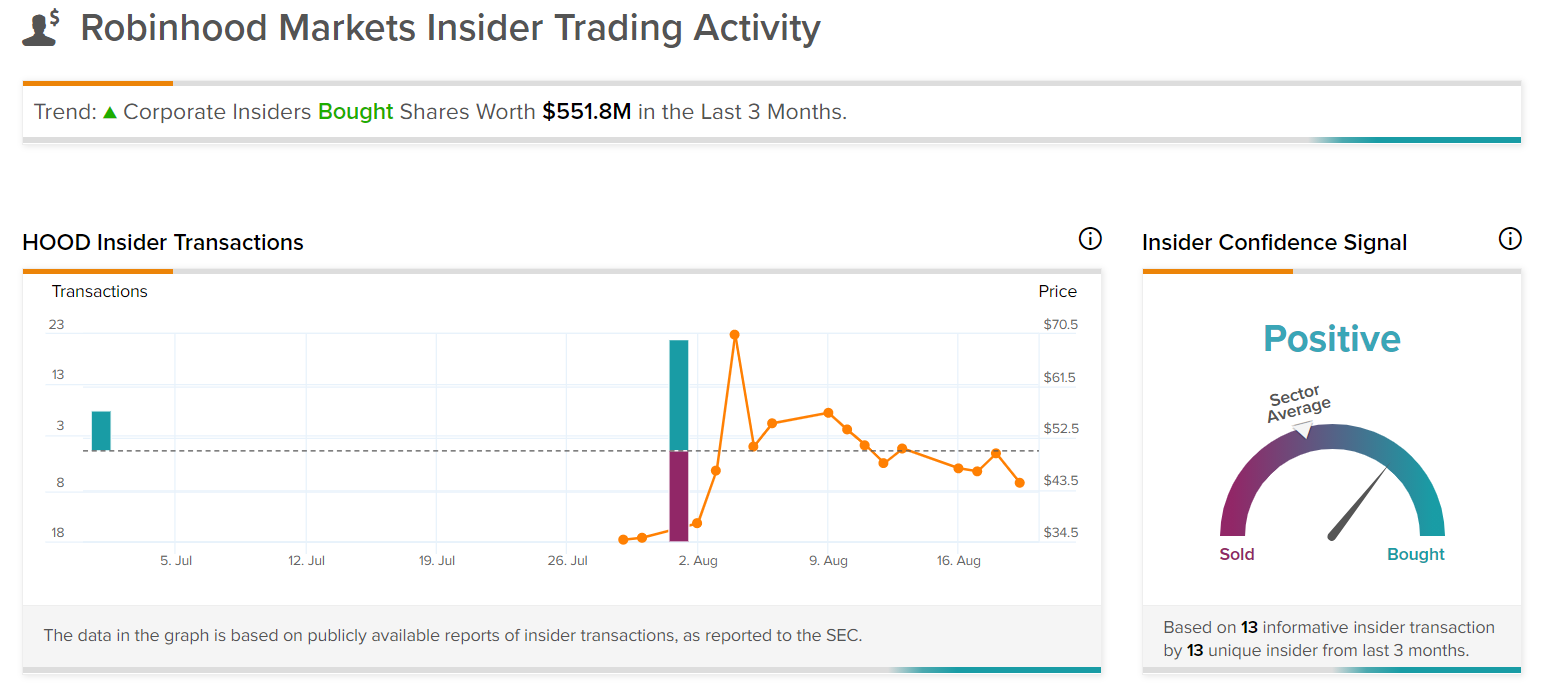
However, the company still has a high insider confidence signal as per TipRanks analytics, based on 13 informative insider transactions by 13 unique insiders during the last 3 months. In the last 3 months, corporate insiders had purchased shares worth $551.8M.
There has been a strong interest in Robinhood’s IPO Access feature, which lets retail traders invest in companies at their IPO prices. The company expressed optimism that more and more new issuers will view Robinhood as a way to better align themselves with their retail shareholders. Robinhood is also considering selling branded merchandise, in a move similar to AMC, which is expected to open up another revenue stream.
HOOD has introduced stock trading to a new generation. However, the bottom-line is that the company is still a relatively new player in the market. Here’s how to trade HOOD now.
HOOD Chart
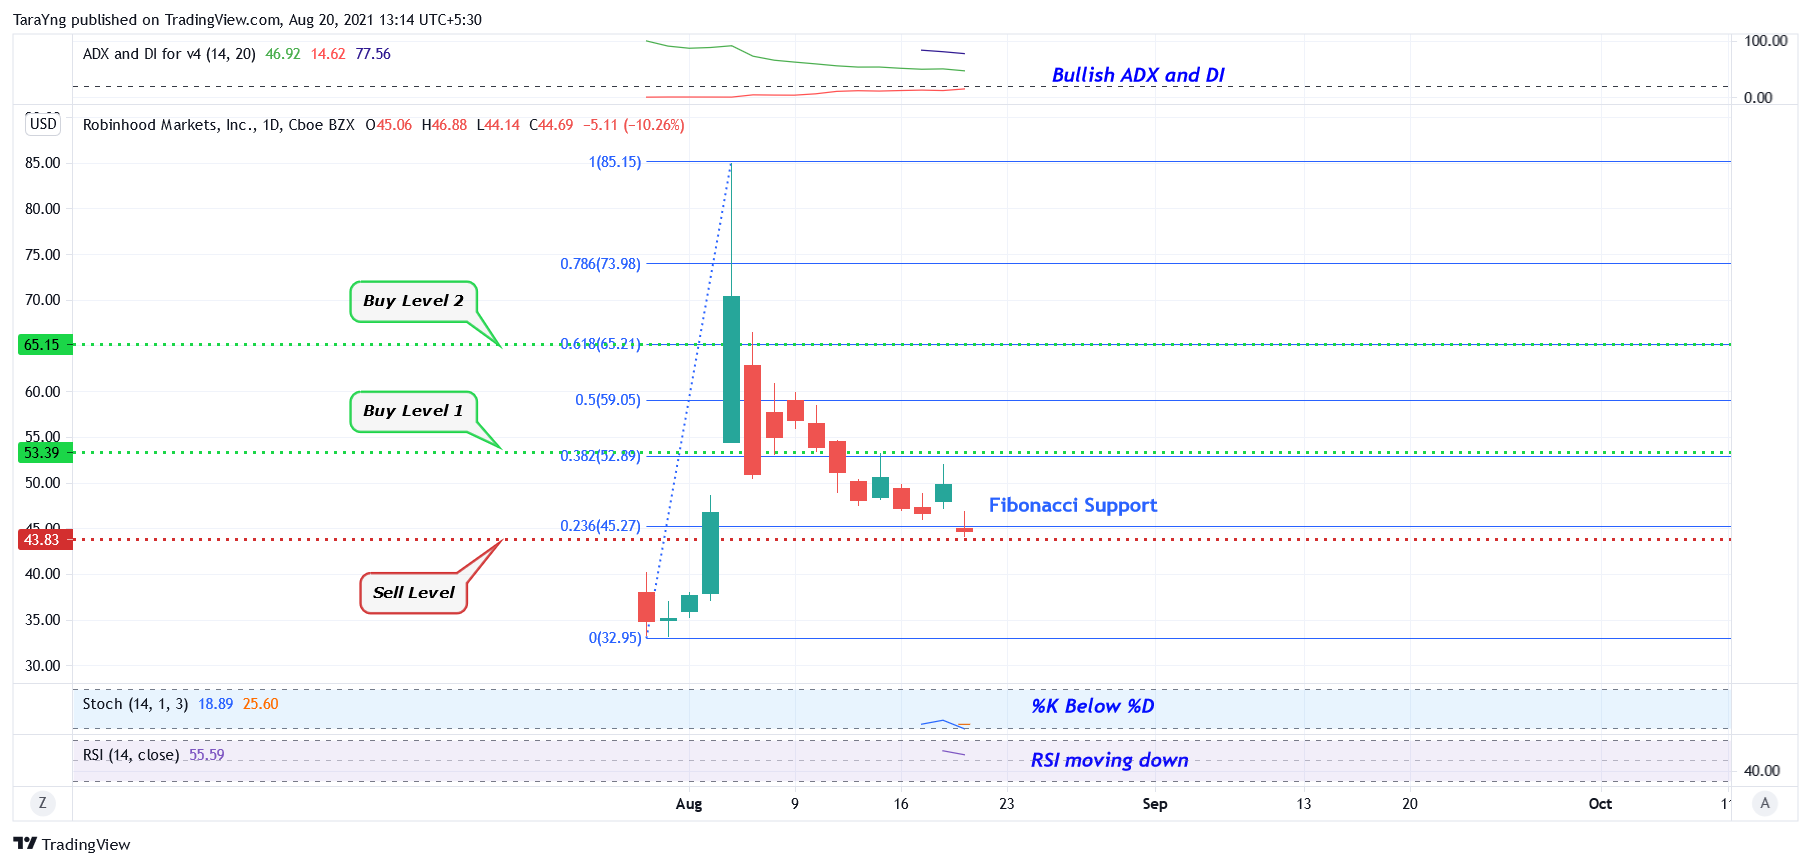
On analysis, there are mixed signals in the daily chart of HOOD.
#1 Fibonacci Support: Usually, after an up-move, stocks retrace to any of the key Fibonacci levels before surging back again. The stock’s daily chart shows that it is currently near the 23.60% Fibonacci support level of the upmove. This is marked in blue color. Any upmove from a Fibonacci support level would indicate bullishness.
#2 Bullish ADX and DI: The ADX line has currently moved up from below –DI and +DI lines. The +DI line and the ADX line are also currently above –DI line. This is also a possible bullish sign.
However, there are also bearish signals for the stock, as the %K line is below the %D line of the stochastic, and the RSI is currently moving down.
Below are the bullish and bearish play for HOOD.
Recommended Bullish Trade (based on the chart)
Buy Levels: If you want to get in on this trade, the buy level for HOOD is in two scenarios. These are marked as green color dotted lines in the daily chart.
- Buy Level #1: You can purchase half the intended quantity of shares of HOOD above the 38.5% Fibonacci retracement level. This translates to a price of $53.00.
- Buy Level #2: You can purchase the remaining shares of HOOD above the 61.8% Fibonacci retracement level. This translates to a price of $65.00.
Important Note: Make sure that you only enter the trade once the daily close is above the recommended price level.
TP: Our target prices for various buy levels are as follows
- The target prices for Buy Level #1 ($53.00) are $65 and $75 in the next 3 to 6 months.
- The target prices for Buy Level #2 ($65.00) are $75 and $85 in the next 3 to 6 months.
SL: To limit risk, place a stop loss at the following levels.
- The stop loss for Buy Level #1 ($53.00) is $46.00.
- The stop loss for Buy Level #2 ($65.00) is $59.50.
Note that the stop loss is on a closing basis.
Target Upside: Our target potential upside is 15% to 42% in the next 3-6 months.
- Entry at Buy Level #1 ($53.00): For a risk of $7.00, our first target reward is $12.00 and the second target reward is $22.00. This is a nearly 1:2 and 1:3 risk-reward trade.
- Entry at Buy Level #2 ($65.00): For a risk of $5.50, our first target reward is $10.00 and the second target reward is $20.00. This is a nearly 1:2 and 1:4 risk-reward trade.
In other words, this trade offers 2x to 4x more potential upside than downside.
Risks to Consider: The stock may reverse its overall trend if it breaks down from the 23.60% Fibonacci support level with high volume. The sell-off of the stock could also be triggered in case of any negative news, overall weakness in the market, or any regulatory changes in the sector.
Recommended Bearish Trade (based on the chart)
In case the stock breaks down from the 23.60% Fibonacci support level with high volume, it would point to an upcoming short-term correction. In that case, below are the entry level, stop loss level, and target prices.
Sell Level: You can take short positions on HOOD below the price of around $43.00. This sell level is marked as a red color dotted line in the chart.
Important Note: Make sure that you only enter the trade once the daily close is below the recommended price level.
TP: Our target prices are $33 and $25 in the next 3-6 months.
SL: To limit risk, place a stop loss at $48. Note that this stop loss is on a closing basis.
Our target potential downside is 23% to 42% in the next 3-6 months.
For a risk of $5.00, our first target reward is $10.00 and the second target reward is $18.00. This is a nearly 1:2 and 1:4 risk-reward trade
In other words, this trade offers nearly 2x to 4x rewards compared to the risks.
Risks to Consider: The stock may reverse its overall trend if it breaks upwards with high volume. The breakout of the stock could be triggered in case of any positive news, overall strength in the market, or any regulatory changes in its sector.
Happy Trading!
Trades of the Day Research Team


