
I have run my public real-money Dividend Growth Portfolio (DGP) since 2008. While the DGP is generally a buy-and-hold enterprise with little turnover, it is not a passive buy-and-ignore portfolio.
Indeed, one of the things I try to accomplish and demonstrate through the DGP is thoughtful portfolio management.
The DGP’s business plan designates specific circumstances that call for possibly selling or trimming a position.
- One such guideline kicks in if a position exceeds the maximum size that I allow. If a position exceeds 8% of the portfolio, I consider trimming it.
- Another guideline calls for a serious look when a position becomes way overvalued.
On occasion, a position triggers both guidelines. That’s not surprising, because a stock whose price rises beyond reasonable valuation might also grow large enough to become an oversize position.
Microsoft (MSFT), of course, is one of the hot tech stocks that have led the market’s resurgence from the pandemic crash back in 2020, as shown in the following chart. Not only has its price gone relentlessly uphill since the pandemic crash, but it’s been out in front of the S&P 500 Index as a whole, helping pull the entire index up.
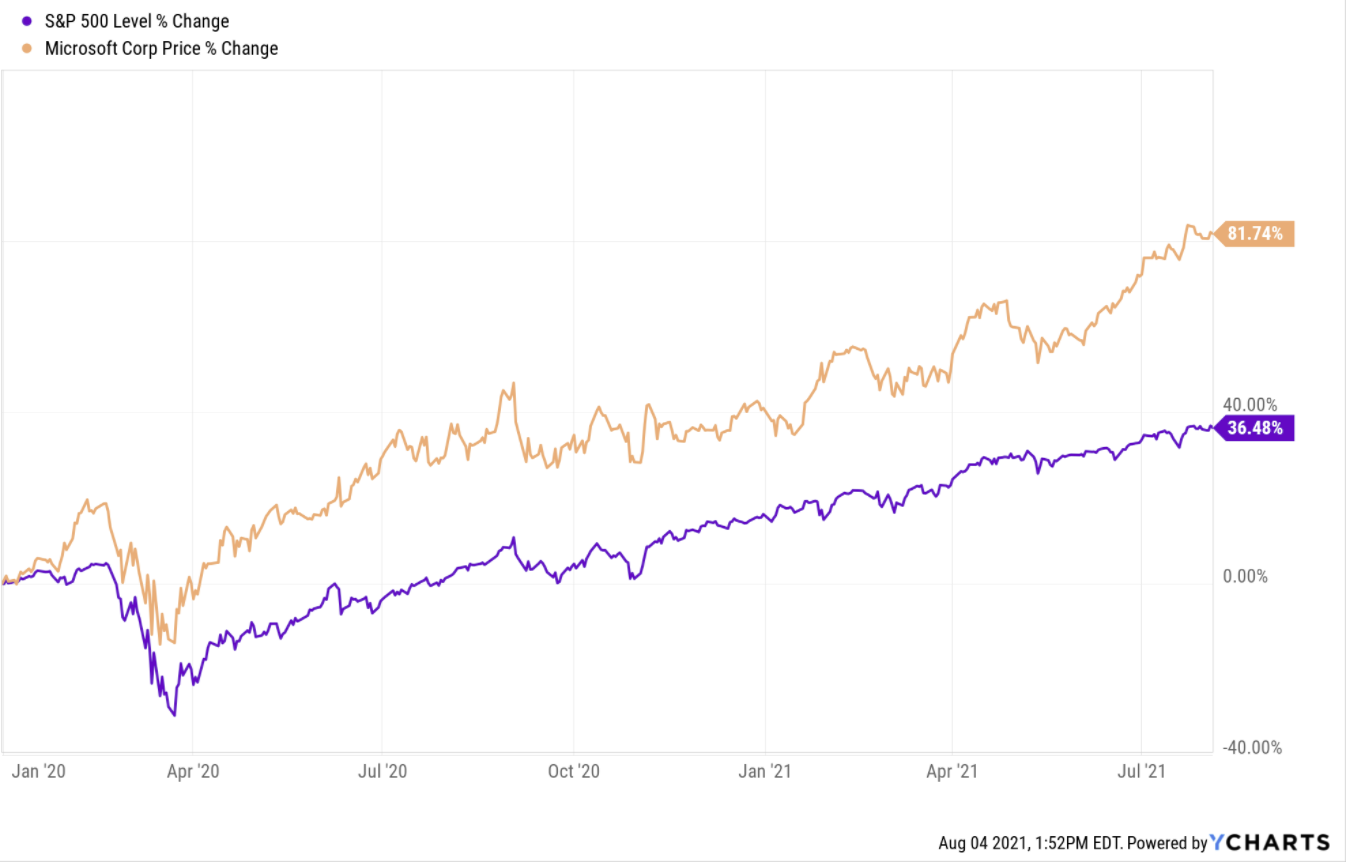 The S&P 500 has no position size limits; it is a “cap-weighted” index. That means that any company in the index is allowed to grow as large as its price takes it. Microsoft has grown to become the 2nd-largest position in the S&P 500, behind only Apple (AAPL).
In my portfolio, Microsoft has been oversized and overvalued before. In fact, I trimmed it already once this year, in January.
Before trimming it this time, Microsoft had grown to 8.3% of my portfolio. That’s more risk than I want in a single position. Indeed, that’s far more risk than most investors would allow in a single position. Many investors have “full-size” limits that are 2%, 3%, or 4% of their portfolios.
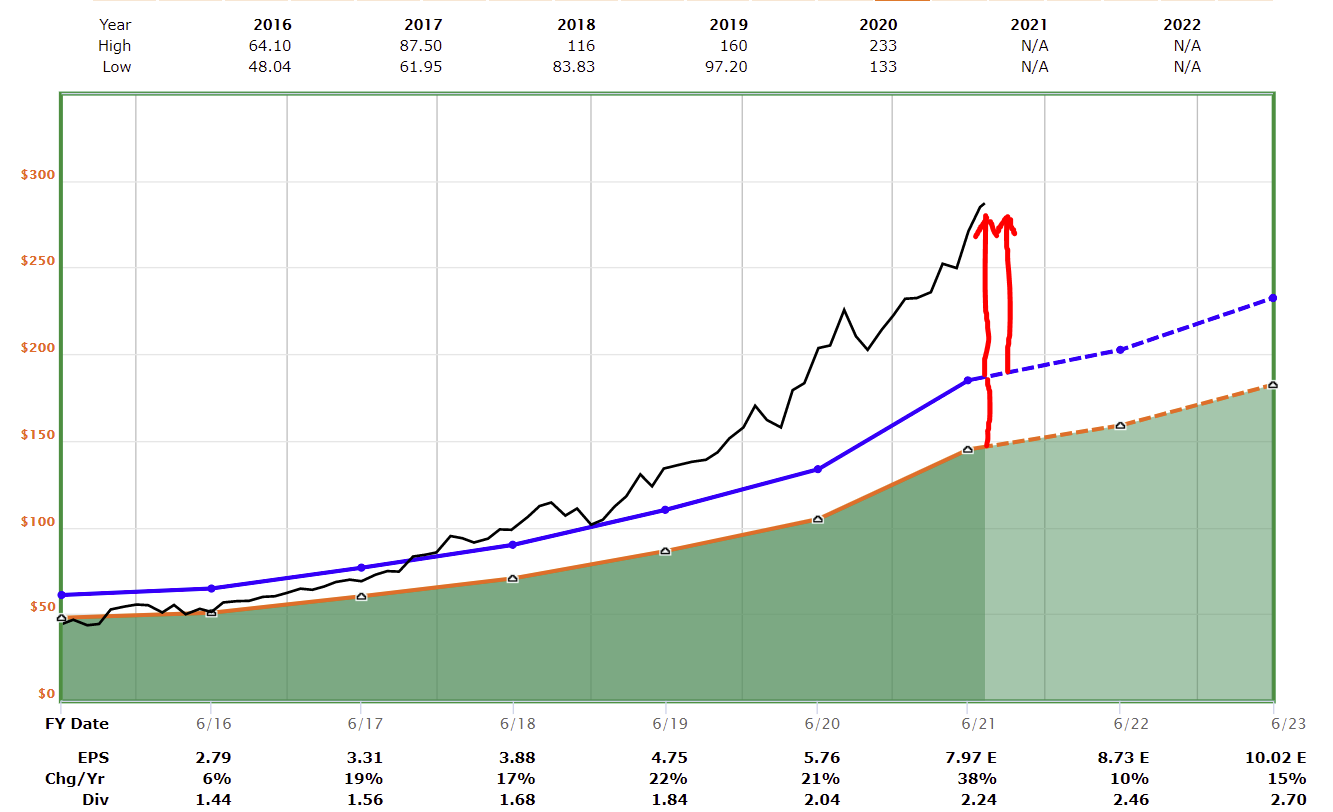
And Microsoft is overvalued, as seen in this chart from FASTGraphs that shows MSFT’s price being far above the two fair-value reference lines.
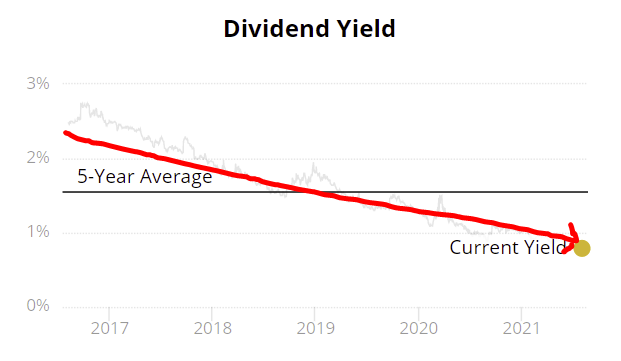
 You probably know that yield and price are inversely related: As price goes up, yield goes down. That’s what has happened to Microsoft’s yield over the past five years. While MSFT’s yield has approached 3% in the past, its yield has slid to just 0.8% over the past five years.
 And that has happened despite MSFT increasing its dividend each year. This chart covers the same time-frame as the one above.
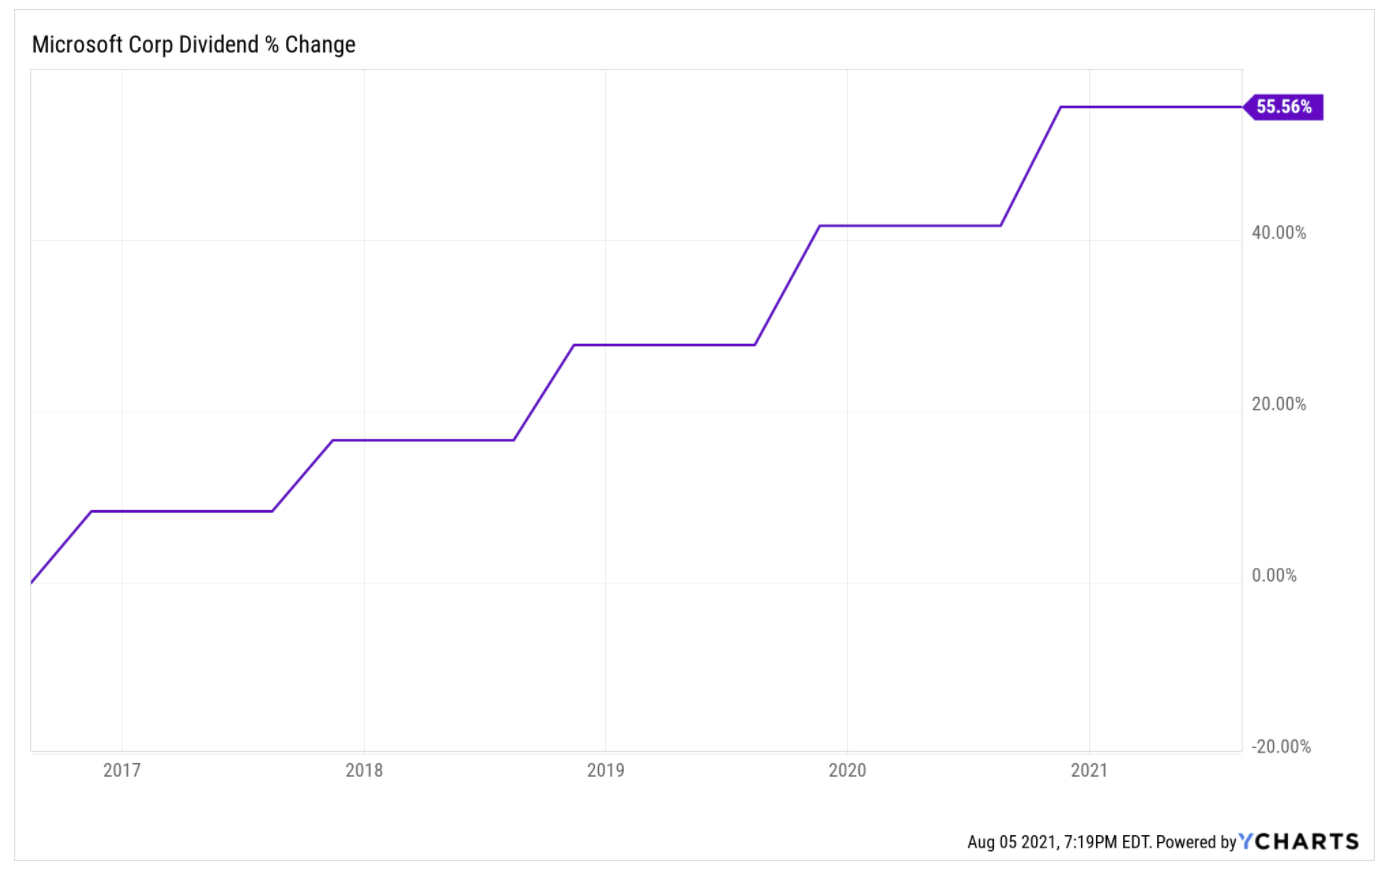 Microsoft’s meteoric price rise has overwhelmed the pace of its dividend increases, even though those have been generous at 9% per year over the past five years. That’s why its yield has dropped below 1%.
To sell or trim such a hot stock flies in the face of a lot of conventional wisdom. Many investors say, “Let your winners run.”
I understand why they say that, but that is mostly a price-centric concept. This portfolio is income-centric. My goal in allocating my investment capital is to increase my income flow, within the strategic framework that guides everything that I do, as laid out in the business plan.
Selling
To get Microsoft back under 8%, I decided to sell about $2000 worth. I did that on August 4, letting go of 7 shares. The sale brought $1999 cash into my account.
Replacing
My “shopping list” consists of (1) stocks already in the portfolio, (2) stocks I have written favorably about over the past 12 months, and (3) stocks in my Top 30 Dividend Growth Stocks for 2021 eBook.
I decided to use aisle #1 and add to my two newest and smallest positions: Schwab’s dividend-growth U.S. Dividend Equity ETF (SCHD), and the pharmaceutical giant Merck (MRK).
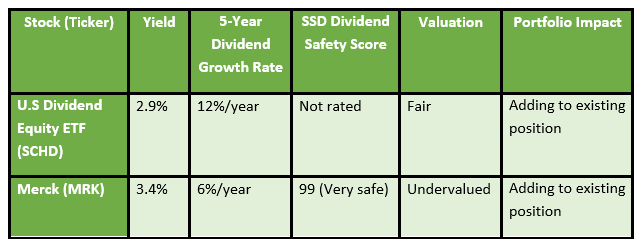 I split the money equally between these two choices. When I was done, I had made these additions to the portfolio. The green dot indicates the money coming in from the sale of MSFT, and the red dots indicate the money spent on the two purchases.
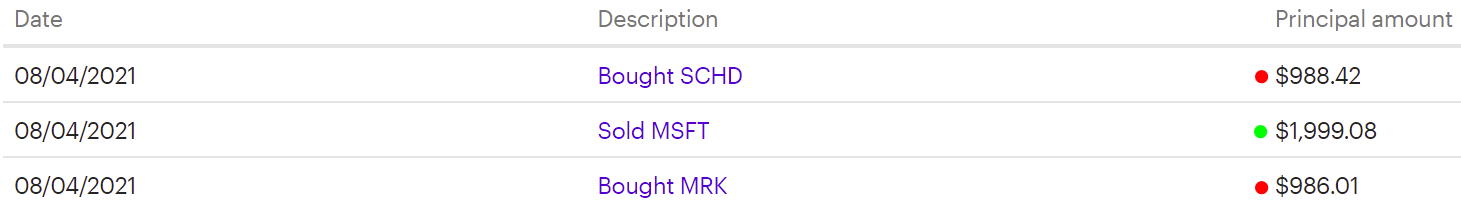 The total amount spent was $1974. That left $25 in cash behind, which goes into the kitty for August’s dividend reinvestment in a couple of weeks.
Portfolio Before and After
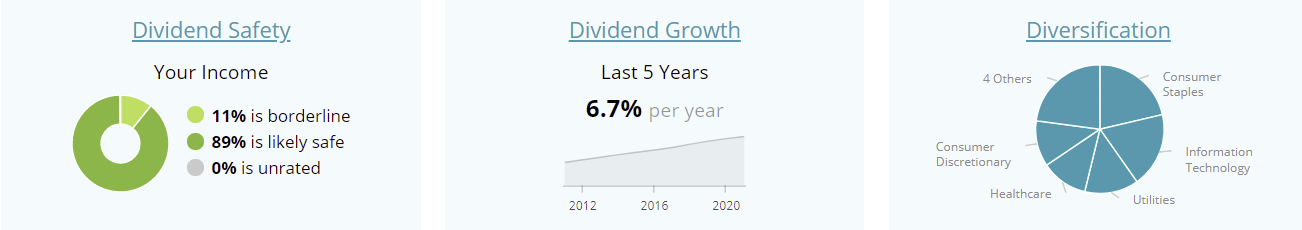
Here, from Simply Safe Dividends’ Portfolio function, is a snapshot of the portfolio prior to the transactions:
Before Trimming MSFT
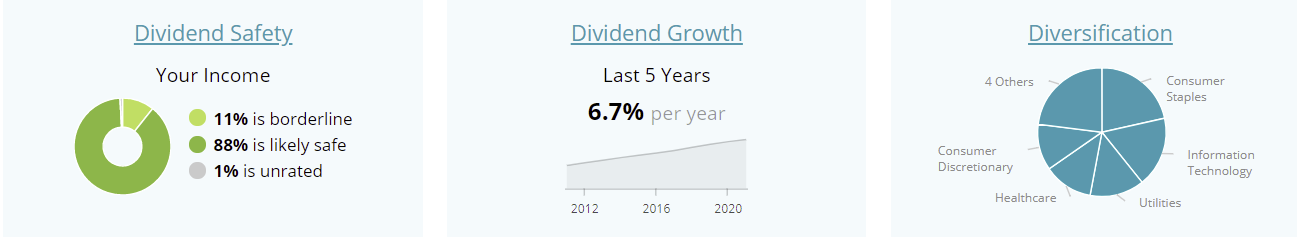
 And here is the summary after making the trades:
After Trimming MSFT and Purchasing MRK and SCHD
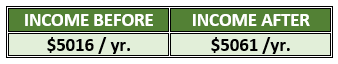
 Here is how those trades boosted my portfolio’s dividend income:
 What did the transactions accomplish?
- The DGP’s annual dividend income went up $45 per year, or about 1%.
- The additional income caused the portfolio’s current yield to inch up fractionally to 3.1%.
- The portfolio’s diversification stayed nearly the same, with the SCHD allocation registering now at 1% of the portfolio. Information Technology shrank a little and Health Care rose a little (almost impossible to see on the pie charts).
- Overall dividend safety stayed almost exactly where it was, and the portfolio’s organic dividend growth rate remained the same.
- The DGP becomes a little more balanced, with no position exceeding 8% of the portfolio, and the two smaller positions gaining in size. My allocation to MSFT drops back to 7.1%, giving it a little room to grow before it bumps up against the 8% limit again.
- The portfolio’s yield on cost goes up 0.1% to 10.8%. I am climbing back toward the 11.1% it was before I sold and replaced AT&T in July.
Closing Thoughts
I always say to invest like you’re the CEO of your own business. Perhaps the most important decisions a business owner makes are about how to allocate capital.
That’s what I am doing here: I am moving capital from an oversized and overvalued position into two investments that are better valued, have higher yields, and have plenty of room to grow in my portfolio.
For more insight into running your investing like a business, see DGI Lesson 12: Run Your Investing Like a Business.
For more insight into my two replacement purchases, see these articles:
Dividend Growth Stock of the Month for May 2021 — SPECIAL EDITION: SCHD
High Quality Dividend Growth Stock for May 2021: Merck (MRK)
All of the changes in the DGP will be reflected in the next monthly portfolio update at the beginning of September.
–Dave Van Knapp
Get More Great Stock Ideas for 2021 from My Dividend Growth eBook
 My book contains complete analyses of 30 great stocks for the new year. UGI is just one example.
Not only that , the book has a comprehensive investment manual that is suitable for beginners and experienced investors alike. Clocking in at more than 200 pages, the Sensible Guide to Dividend Growth Investing is really a complete book in itself.
Please click on this link for more information. As a gift, I will send you a free booklet that explains compounding. Even if you don’t purchase the book, sign up for the newsletter. I email it monthly with helpful information for dividend growth investors along links to my most recent articles.
Source: DividendsAndIncome.com
The goal? To build a reliable, growing income stream by making regular investments in high-quality dividend-paying companies. Click here to access our Income Builder Portfolio and see what we’re buying this month.