
As I explained in an article a few weeks ago, I have decided to sell AT&T (T) from my Dividend Growth Portfolio and replace it with one or two other stocks. In the article explaining my decision, I presented 11 stocks as candidates to replace AT&T.
One of those potential replacements is Prudential Financial (PRU). So in this article, I am going to take a deep dive into Prudential to see how good it really is.
 Prudential’s Dividend Record
 Prudential’s Dividend Record
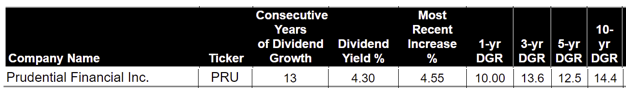
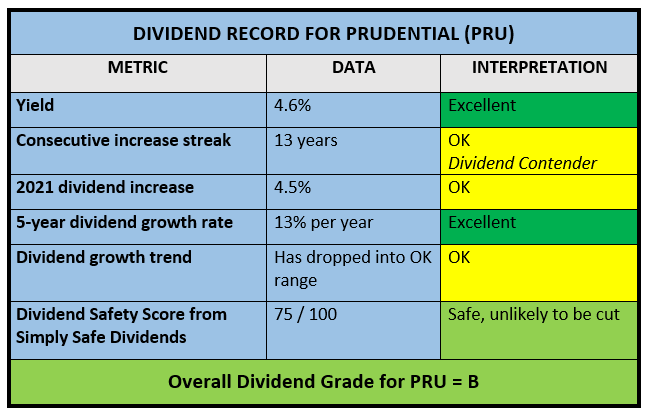 Prudential is a high-yield, mid-growth DG stock.
Its most attractive dividend feature is its high yield, at 4.6%.
PRU’s 13% 5-year dividend growth rate (DGR) is a little misleading, as its increases have been dropping over the past few years, as shown here.
 But the overall effect has been to bring its DGR into an acceptable range for a stock with PRU’s high yield, so I am not concerned by the falling DGR. This year’s 4.5% increase was solid, and if that becomes the norm going forward, I’d be fine with that.
Per Simply Safe Dividends, Prudential’s dividend is safe and unlikely to be cut. The safety grade of 75/100 was just reaffirmed in May following PRU’s Q1 earnings release.
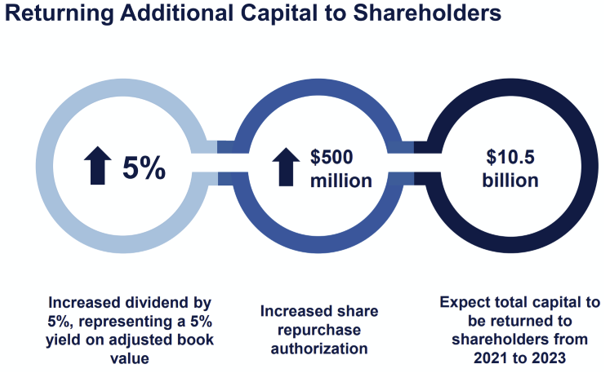
I always like it when a company highlights its dividend program, and Prudential did that in its Q1 earnings presentation:
Business Model and Company Quality
 Business Model and Company Quality
Prudential Financial is a leading financial services provider with approximately $1.7 trillion of assets under management. It operates primarily in the USA, Asia, Europe and Latin America.
Prudential offers a wide array of products and services, including life insurance, annuities, retirement-related services, mutual funds, and investment management. It has one of the largest distribution networks in the financial services industry, enabling it to reach individual and institutional customers.
Prudential’s main segments are:
- PGIM – Global Investment Management – contributes 22% of earnings
- S. Businesses – dominated by individual annuities and life insurance – contributes 38% of earnings
- International Businesses – primarily in Japan – contributes 40% of earnings
Prudential has been in business for over 140 years. It employs around 50,000 people world-wide.
Prudential serves more than 50 million customers in over 40 countries. It is one of the 10 largest asset managers in the world, trailing such companies as BlackRock, Vanguard, Fidelity, and a few others.
Prudential is in the midst of a multi-year cost savings program that is expected to run through the end of 2023, with total savings of $750 M by the end.
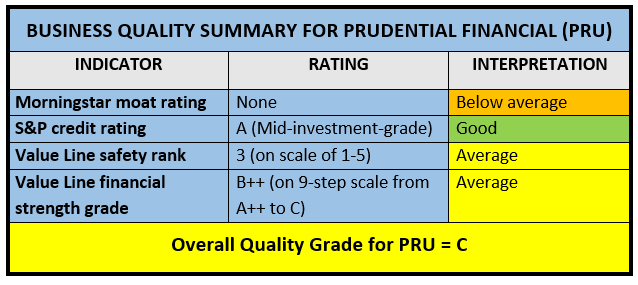
Morningstar awards Prudential no moat. They believe that in general, life insurers do not command favorable competitive positions, because of fierce competition and the commoditized nature of products.
Segments such as asset management and retirement services can have moats, but Morningstar feels they are usually not large enough components to merit overall moats when housed within insurance companies. Prudential’s asset-management segment accounts for 22% of its earnings.
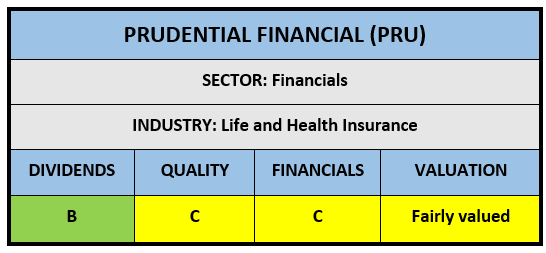
Prudential’s third-party ratings on quality factors are middle-of-the-road, and I give it an overall quality grade of C.
Prudential’s Financials
 Prudential’s Financials
Prudential’s sales had been slowly growing annually until 2020, when Covid impacted its revenues. The company is presently recovering from that interruption.
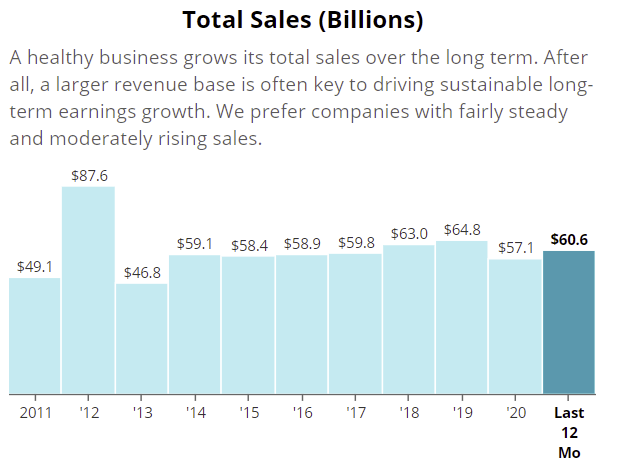 (Source of all graphics in this section: Simply Safe Dividends)
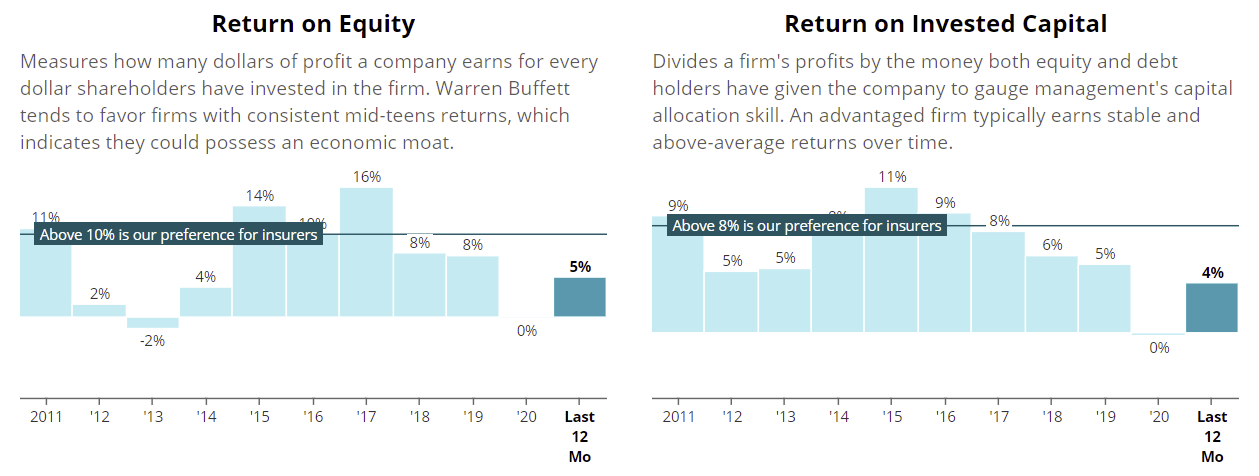
Prudential is not a highly efficient business as reflected in two common measures of efficiency.
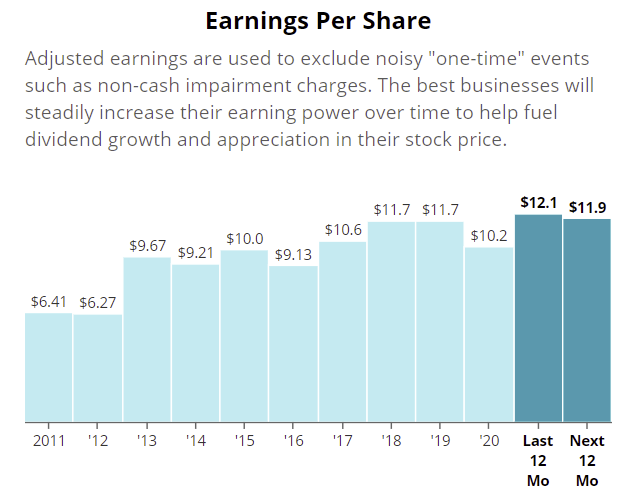
 That said, Prudential is profitable. It has compiled a generally rising record of earnings over the last decade, although the growth has had some ups and downs, including a drop in 2020 largely due to covid.
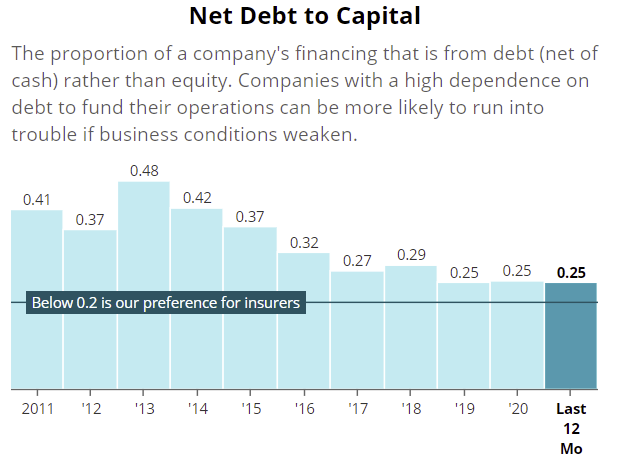
 Prudential’s debt situation is interesting. Simply Safe Dividends shows it as a little higher than the benchmark it uses for insurers:
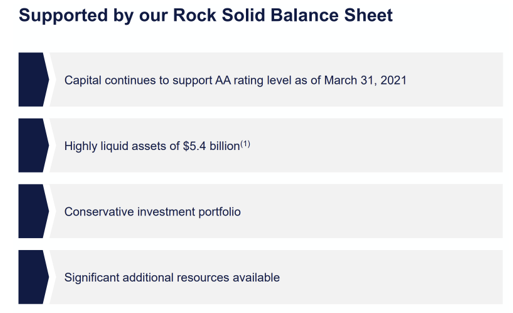
 But the company, in its recent earnings presentation, portrays itself has having a “rock-solid balance sheet.”
 It is noteworthy that S&P assigns Prudential a credit rating of A, with a stable outlook. A rating of A is a solid, above-average credit rating. Overall, I would say that Prudential’s debt situation is fine.
Prudential has had a highly effective share repurchase program ongoing for years.
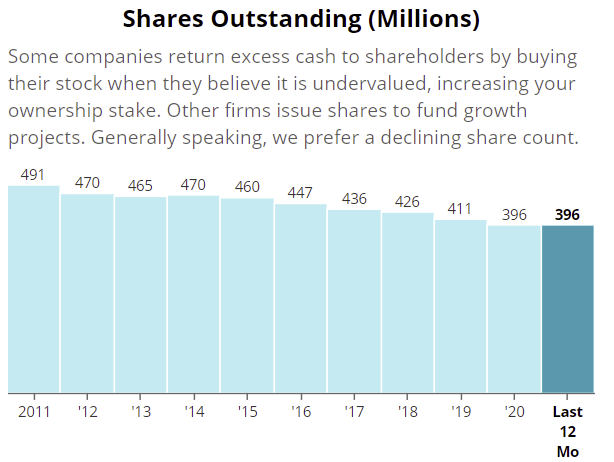 The company has 20% fewer shares outstanding now than it had a decade ago.
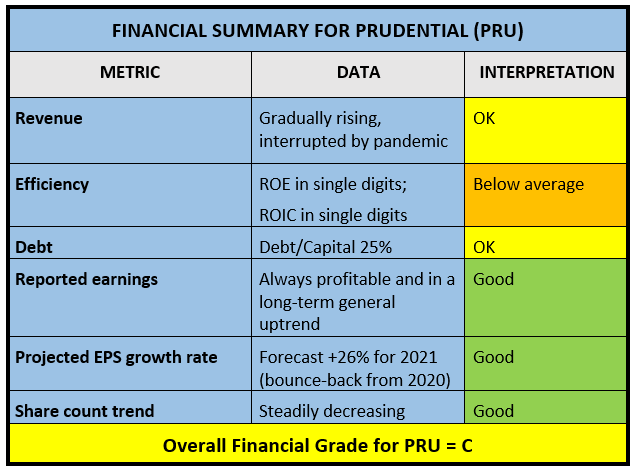
Here is a summary of Prudential’s financials. Overall I give it a C.
Valuation
 Valuation
I use four models in valuing companies, then average the results. See Dividend Growth Investing Lesson 11: Valuation.
Models #1 and #2: FASTGraphs relative P/Es
The first two models use FASTGraphs. Model #1 is a basic estimate of the stock’s fair value based on a general market history, while Model #2 “normalizes” #1 by using the stock’s own past 5-year average valuation rather than the market’s.
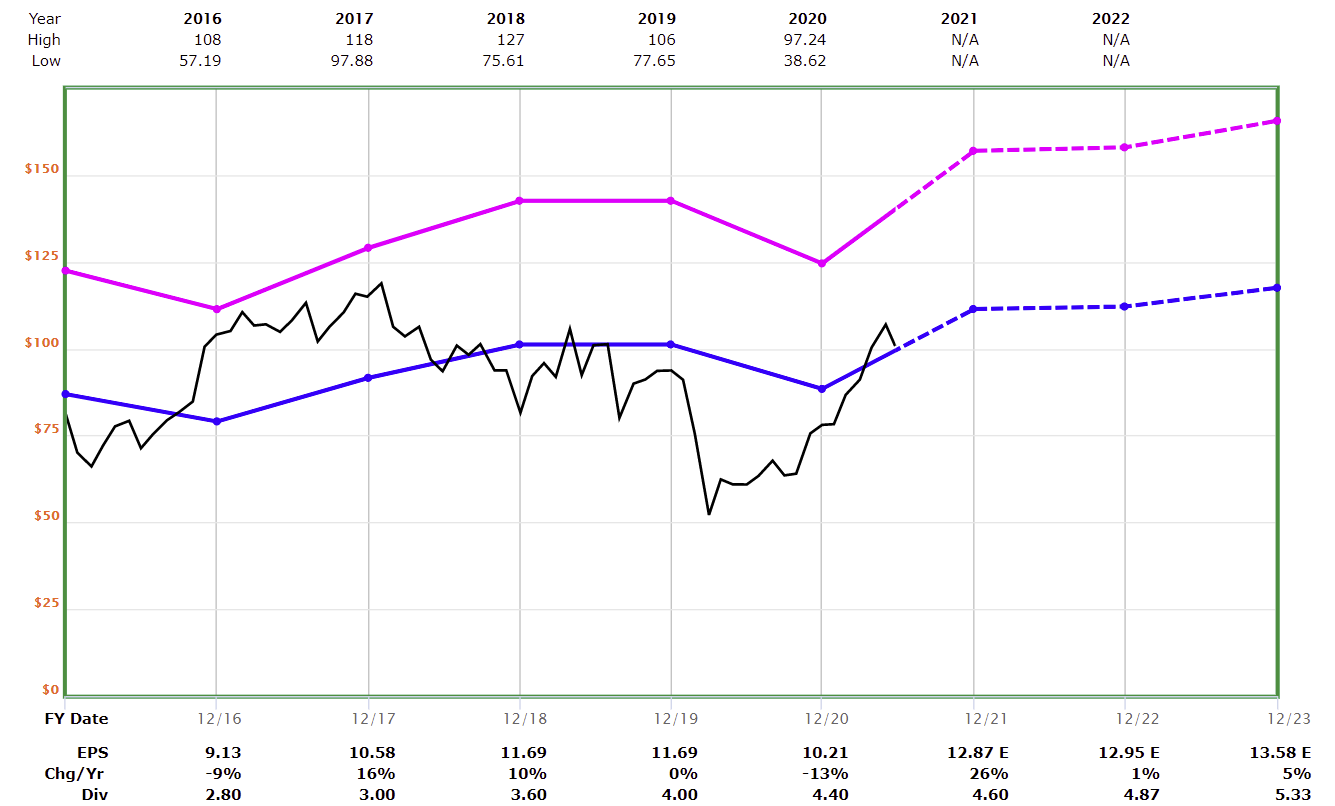 The magenta line is Model #1, a reference line based on the financial sector’s P/E ratio of 12.2. The blue line is Model #2, based on PRU’s own average 5-year P/E of 8.7. PRU’s current P/E ratio is 8.8.
The black line is PRU’s actual price. That price is currently very close to the blue (normalized) reference line, indicating that the stock is fairly priced. The price is below the magenta line, suggesting undervaluation.
To have a common quantitative method across all four models, I compute valuation ratios, which express each model as a ratio of actual price to fair price. Here is the formula for these first two models:
Valuation Ratio for FASTGraphs = Current P/E divided by Reference P/E
Here are the valuation ratios for PRU:
- Model 1: Based on basic (magenta) line: 8.8 / 12.2 = 0.72
- Model 2: Based on historical (blue) line: 8.8 / 8.7 = 1.01
Model #3: Morningstar DCF Valuation. Morningstar uses a discounted cash flow (DCF) model for valuation. The idea behind DCF has been summarized by Warren Buffett:
Intrinsic value can be defined simply: It is the discounted value of the cash that can be taken out of a business during its remaining life. The calculation of intrinsic value, though, is not so simple…. [It] is an estimate rather than a precise figure. (Source)
Morningstar makes what I believe are conservative, logical estimates and performs the necessary calculations. Just as I did with the first two models, Morningstar converts their result into a valuation ratio, which is circled below.
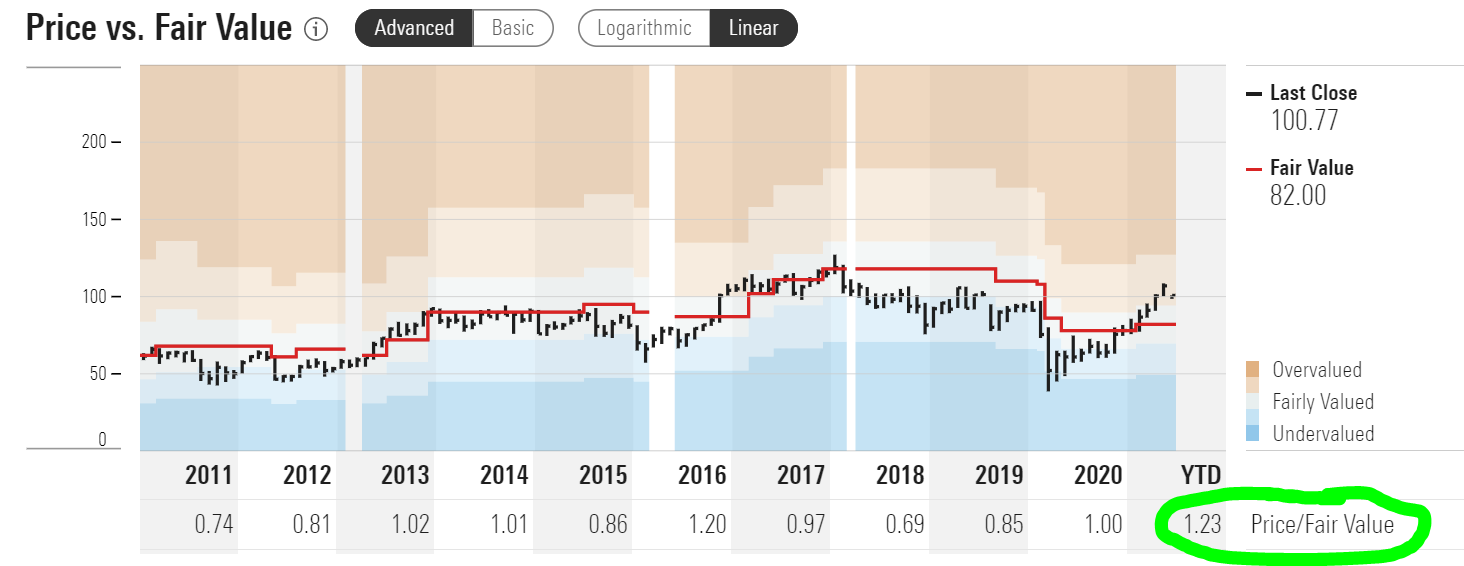 Morningstar’s valuation ratio is 1.23, suggesting that they see PRU as significantly overvalued.
Model #4: Current Yield vs. Historical Yield. The last model compares the stock’s current yield to its historical yield. The idea is that if a stock’s yield is higher than normal, it suggests that its price is undervalued (and vice-versa).
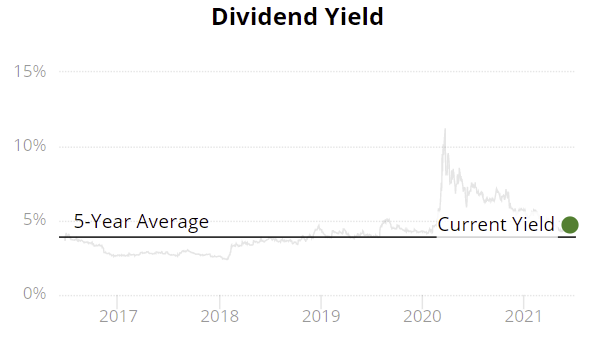 Prudential’s current yield of 4.6% is above its 5-year average of 3.9%. Once again, I compute a valuation ratio.
Valuation Ratio for Relative Yield = 5-Year Yield divided by Current Yield
The valuation ratio in this case is 3.9% / 4.6% = 0.85, or undervalued by 15%.
This table summarizes the four models:
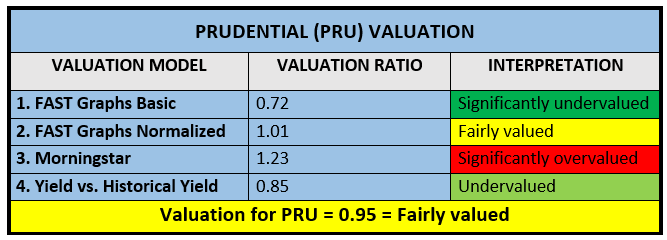 There is considerable variance among the four models. Nevertheless, the two outliers cancel each other out, so I do not feel the need to adjust or toss out either one.
Simply taking the average of the four leaves us with a valuation ratio of 0.95, which is close enough to 1.0 that I consider that to indicate that Prudential is selling within its fair-value range.
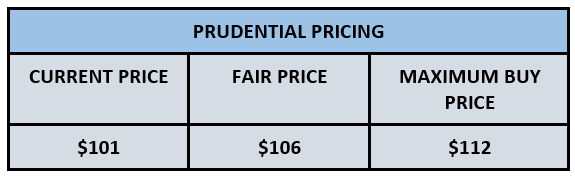
PRU’s recent price is $101. Its calculated fair price is therefore $101 / 0.95 = $106.
For the highest-quality companies, I allow a +/- 10% cushion around my calculation of fair price for a fair-value range. Prudential, while very good, does not merit that wide a range, so I cut it to 5% on the high side.
I get the following outcomes:
PRU’s fair price = $106
PRU’s maximum buy price = $112
PRU’s bargain-basement price = $95
At $101, I consider PRU to be selling at an attractive price right now.
Analysts’ Recommendations
 Analysts’ Recommendations
Many brokerage accounts provide free stock analyses from various data providers. One of the data points often available is a survey of Wall. St. analyst opinions.
Here is how the IBES survey FOR Prudential is summarized in the report from Refinitiv, which I get from E-Trade.
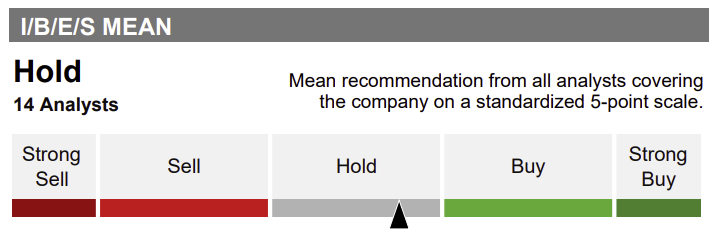 I consider this to be a neutral factor.
The Bottom Line on Prudential
 Prudential’s Positives:
- High-yield (4.6%), mid-growth (5% per year) opportunity. Good dividend safety score (75 /100 from SSD).
- Solid, sustainable, profitable business, with decent business quality ratings from independent analysts and an A-level credit rating from S&P.
- Seems to be recovering nicely from pandemic-induced downturn.
- Fairly valued.
Prudential’s Negatives:
- Average investment-grade ratings in quality and financial aspects.
Conclusion: In my opinion, Prudential is a legitimate candidate to replace some or all of AT&T. Its high yield and dividend safety are attractive, its business is solid enough to support the dividend with no big downsides on the horizon, and it’s available at a slightly discounted price.
This is not a recommendation to buy, hold, sell, trim, or add to Prudential. Any investment requires your own due diligence. Always be sure to match your stock picks to your personal financial goals.
— Dave Van Knapp
Other Reading and Viewing on Prudential
10 High-Quality Dividend Growth Stocks Attractively Valued Today (Chuck Carnevale, May 2021 – video)
Buy These 3 High-Yield Stocks if You’re in Your 50s (and Glide into Retirement) (Jason Fieber, April 2021)
Motley Fool Stock Advisor's average stock pick is up over 350%*, beating the market by an incredible 4-1 margin. Here’s what you get if you join up with us today: Two new stock recommendations each month. A short list of Best Buys Now. Stocks we feel present the most timely buying opportunity, so you know what to focus on today. There's so much more, including a membership-fee-back guarantee. New members can join today for only $99/year.
Source: Dividends and Income