
What a week!
During these last four years — four exhausting, crazy, sometimes exhilarating, often disturbing years — how many times have you uttered those words? For me, it’s probably been at least 50, maybe closer to 100 times.
And yet this week might have topped them all, as each day brought different drama involving the race for the U.S. presidency.
For all but a few hours on Election Night — when it seemed Donald Trump was destined to get four more exhausting years — Democratic challenger Joe Biden spent most of the week as the favorite.

In what could be the most prophetic photograph of the 2020 election, Donald Trump holds a press conference on Nov. 5 at the White House … with an exit sign in the foreground. (AP/Evan Vucci)
Although Trump fared better than most pollsters expected, Biden rallied in the week’s final three days thanks to the millions of write-in ballots filed by voters who did not want to venture out during the raging COVID-19 pandemic.
By the time we got to Friday, ballots were still being counted all around the country … but Biden was on the cusp of the presidency, with small but meaningful leads in most battleground states.
Meanwhile, an irate Trump was screaming about voter fraud (without offering any evidence), demanding recounts and filing lawsuits.
With all that going on, the stock market soared for four straight days before catching its breath on a flattish Friday; the 7.32% weekly gain for the S&P 500 was its best since mid-April.
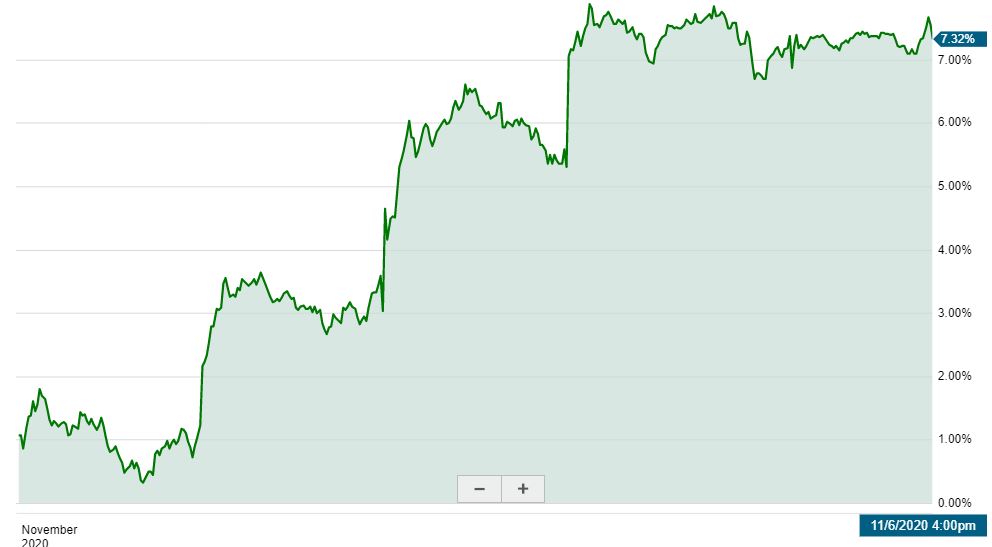
schwab.com
Usually, Mr. Market hates uncertainty, but this time he seemed thrilled by it.
What gives?
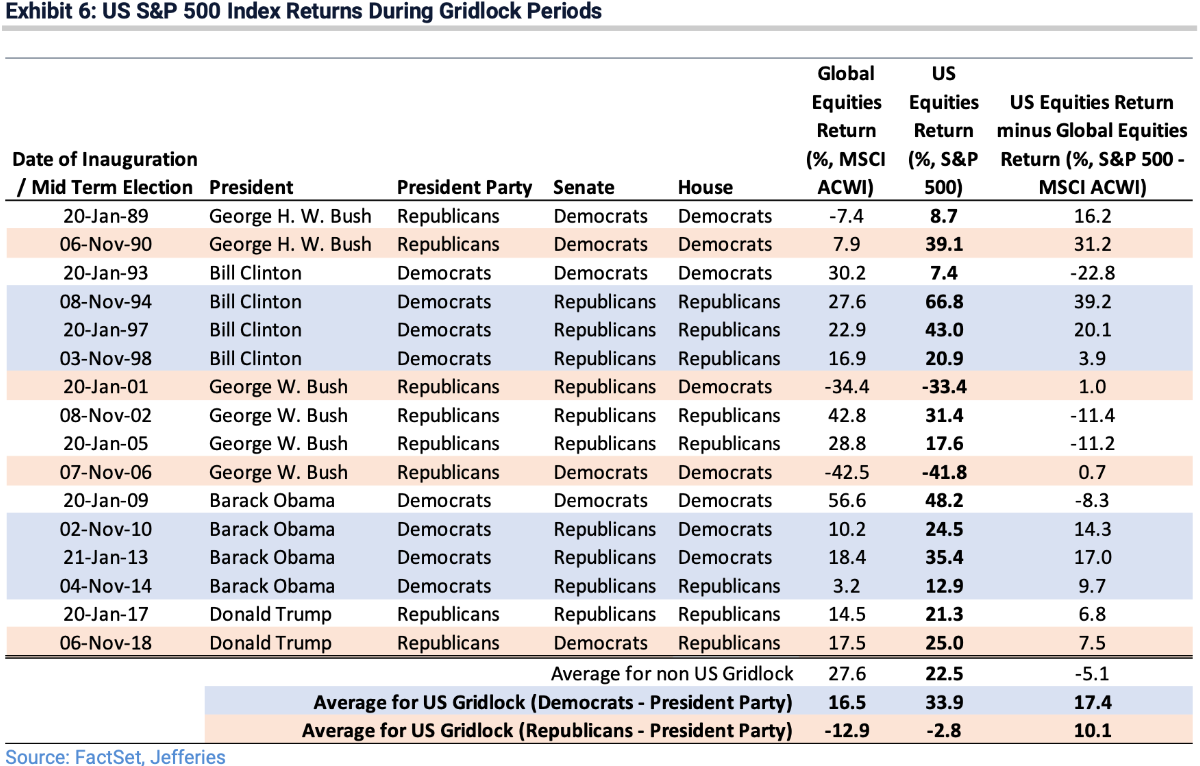
Well, what Mr. Market seems to like more than anything is “gridlock” — when the president is a Democrat and least one house of Congress is controlled by Republicans; theoretically, those situations result in less legislation and regulation, and therefore are pro-corporation.
The following table shows that since 1989, U.S. equities have averaged a 33.9% gain in those situations — compared to a 22.5% gain when the president and Congress are of the same party, and a 2.8% loss with a Republican president and divided Congress.
To me, the lesson is to stay invested in high-quality businesses regardless of who the president happens to be.
Realty Income (O) is one such company.
That’s why I selected the triple-net REIT for DTA’s Income Builder Portfolio (read my analysis HERE), and it’s why on Friday I executed purchase orders for $1,000 worth of O on Daily Trade Alert’s behalf.
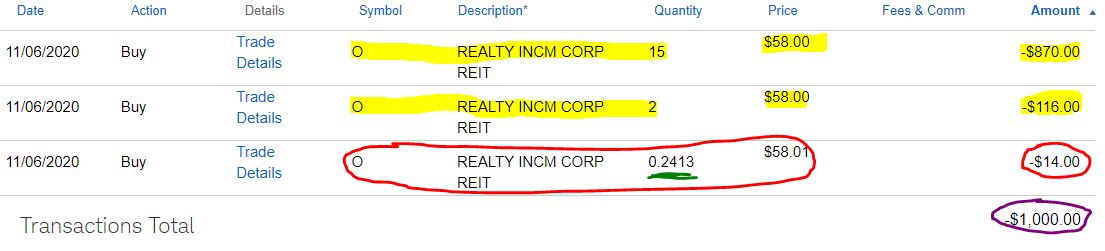
I put in a limit order for 17 shares of O at $58 each; it was filled in two separate transactions a split-second apart, as often happens with limit orders.
I then used the $14 remaining from our $1,000 semimonthly allocation to purchase a fraction of a share utilizing Schwab Stock Slices, giving the IBP a 17.2413-share position.
Dividend Dandy
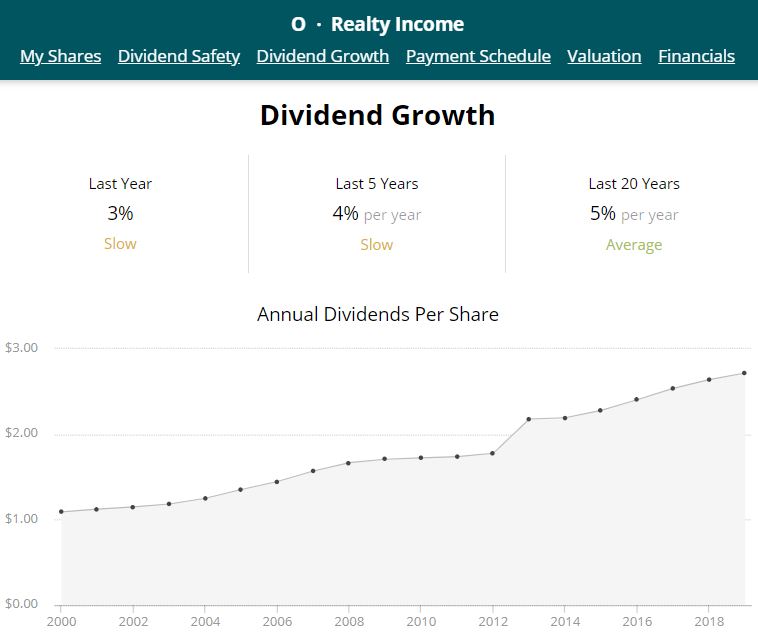
Because of a reliable, growing dividend that is paid monthly, Realty Income has become one of the more popular stocks among Dividend Growth Investing proponents.
The following table shows the company’s payment schedule over the past year.
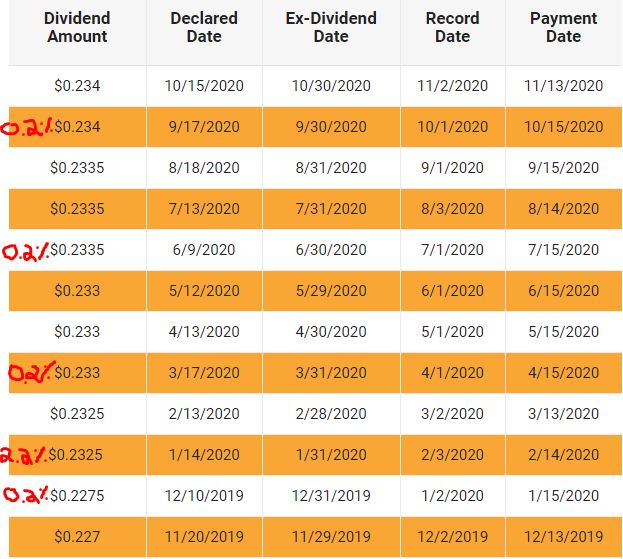
I used a red marker to indicate the dividend increases — 2.2% for the Feb. 14 payment, and four 0.2% raises throughout the year.
Combined, it amounted to 3.1% dividend growth, which has been about the norm in recent years for this relatively high-yielding but slow-growing company.
SimplySafeDividends.com
The ex-dividend date for the November payment has passed, so the first Realty Income dividend to hit the IBP will be on Dec. 15.
Then, on Jan. 15, that 17.31-share position will produce $4.05 in income, which again will be reinvested.
That will happen again and again, month after month, and the compounding effect will gradually build our O position. It also will help build the IBP’s income stream — exemplifying why we gave this endeavor the name we did.

Realty Income receives a 70 score from Simply Safe Dividends. That’s right in the middle of the “Safe” range (61-80) — a little lower than the Very Safe that I prefer.
However, O offers this as the very first sentence on its “About Us” web page:
Realty Income, The Monthly Dividend Company®, is an S&P 500 company dedicated to providing stockholders with dependable monthly income.
Yes, we’re talking about a company very committed to its dividend, a Dividend Aristocrat with a 25+ year history of growing its annual payout. So I’m confident they’ll do whatever it takes to keep those Divvy Dollars coming.
Analyze This!
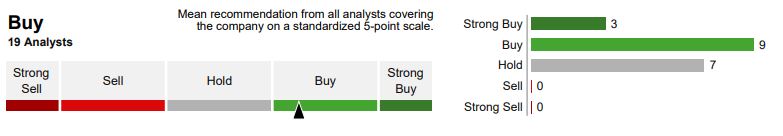
Analysts are generally upbeat about Realty Income’s prospects.
As the following graphic from Fidelity shows, 12 of the 19 market-watchers surveyed by Thomson Reuters consider O to be a Buy or Strong Buy.
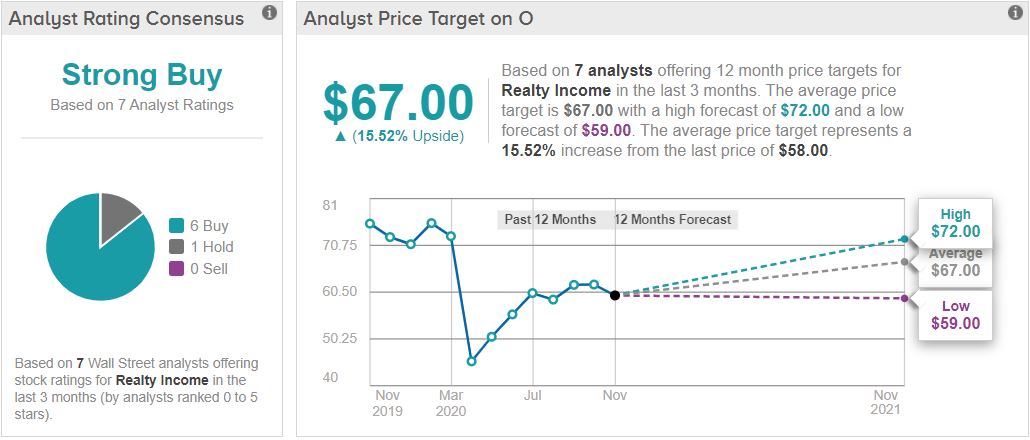
Six of the 7 analysts polled by TipRanks call Realty Income a Buy, and their average 12-month target price is $67 — about 15% higher than now.
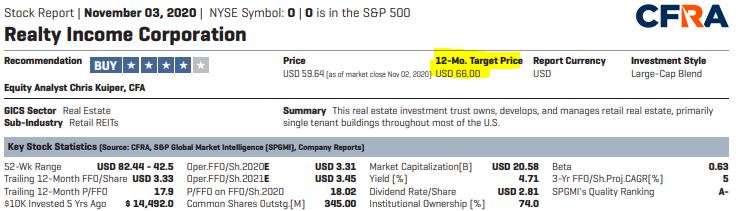
CFRA’s analyst has a similar view, with a $66 target price and a Buy rating.
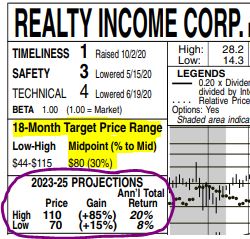
Value Line includes Realty Income in its model portfolio of “Stocks For Income And Potential Price Appreciation.”
The midpoint of Value Line’s 18-month price range for O suggests a 30% gain (yellow highlight below), and the 3-to-5-year outlook forecasts annual returns from 8% to 20% (purple circle). I’d be quite happy if VL ends up being correct.
Valuation Station
With REITs, adjusted funds from operations (rather than earnings) are the main metric used when calculating valuation.
FAST Graphs says Realty Income’s current blended price/AFFO ratio is 17.02, about 10% below the 10-year normal P/AFFO ratio of 18.88 — suggesting that O is somewhat undervalued.
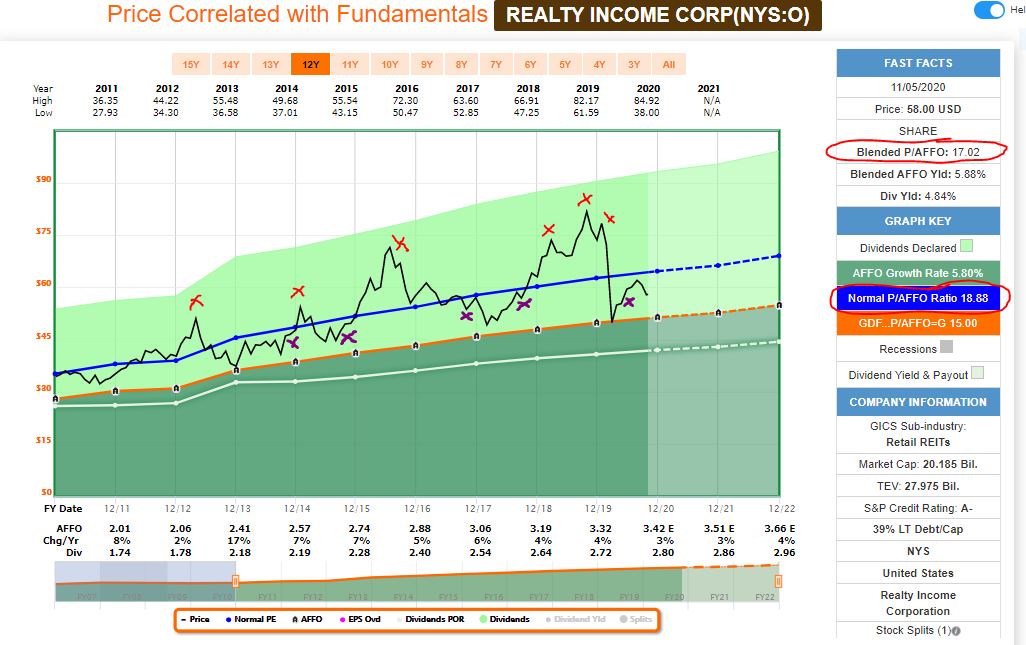
Most times in the past 10 years when Realty Income had a P/AFFO of 18 or lower (purple X-marks on the FAST Graph illustration), it experienced a stretch of nice price appreciation.
When the P/AFFO surged above 22 (red X-marks), the price inevitably got knocked back down.
So the current 17-ish P/AFFO looks pretty attractive to me.
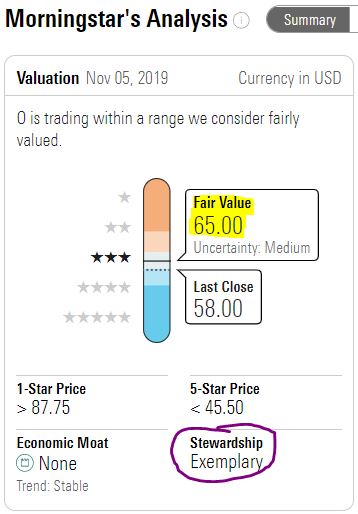
Morningstar Investment Research Center says Realty Income is trading within its fair-value range.
I sometimes like to use a chart showing dividend yield and price to help judge a company’s valuation.
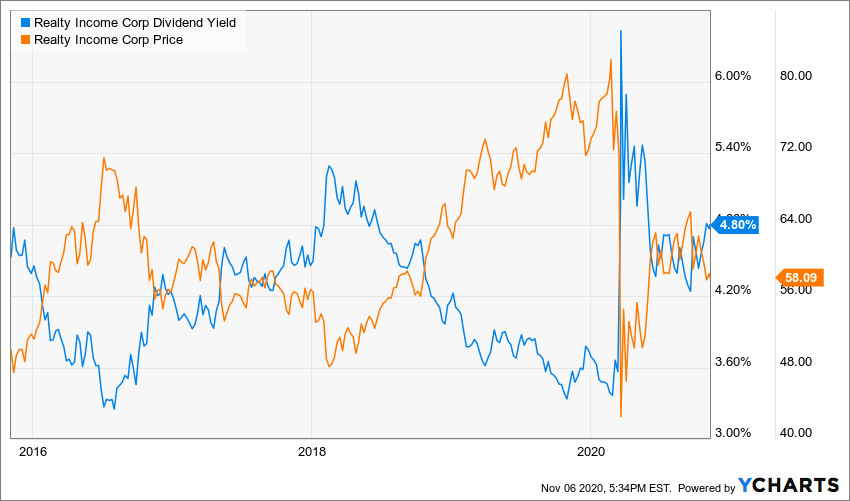
When the blue yield line is higher than the orange price line, it generally means the stock is undervalued. (Vice versa, it is overvalued.) Again, this looks like a decent time to buy O.
Wrapping Things Up
Realty Income becomes the 36th position in the IBP (see the entire portfolio, as well as links to all related articles, HERE), and it is our 7th-highest yielder at 4.8%.
The IBP now owns two of the three Dividend Aristocrat REITs: Realty Income and Essex Property Trust (ESS).
O is the kind of company I like to own regardless of who the president is, no matter which party controls the Senate and the House, and despite the insanity that might be going on in the world around us.
Why? Because I believe that those who run The Monthly Dividend Company® will do what they have promised to do for my portfolio.
— Mike Nadel
The goal? To build a reliable, growing income stream by making regular investments in high-quality dividend-paying companies. Click here to access our Income Builder Portfolio and see what we’re buying this month.
This article first appeared on Dividends & Income