
This article first appeared on Dividends & Income
Principal Financial Group (PFG) was founded in 1879 as an insurance company. Today, based in Des Moines, Iowa, it is a member of the Fortune 500 and a global leader in investment management, retirement plans, and insurance. It operates in 80 countries around the world.

PFG’s Dividend Record

This is a good record for a high-yield stock. The 5.6% current yield has been created mostly by PFG’s steep price drop earlier this year, during the general market meltdown associated with Covid-19. Yield moves inversely to price, so as PFG’s price fell, its yield rose.
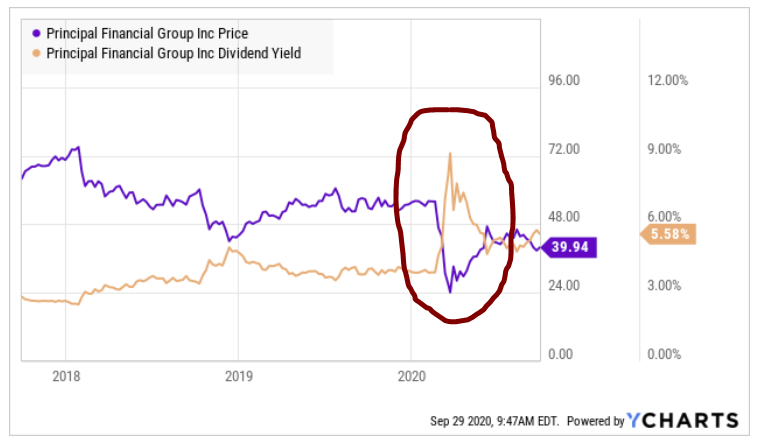 At the low point of the price drop, in February, PFG briefly yielded 9%.
At 5.6%, PFG’s yield is more than 3 times the yield of the S&P 500. Its dividend growth rate has slowed down the past two years, with the 1.8% increase earlier this year undoubtedly impacted by Covid-19.
PFG cut its dividend during the Great Recession (in 2008), but nevertheless its dividend safety score from Simply Safe Dividends is 72 out of 100 points, which categorizes as “safe.”
Overall, I would classify PFG as a high-yield, mid-growth dividend growth stock.
PFG’s Business Model and Company Quality
Principal Financial Group offers financial products for individuals, employers, and institutions.
- For individuals, PFG products are aimed to help saving, investing, and retiring; estate planning and personal trusts; plus life insurance and income protection.
- For employers, PFG offers retirement plans, group insurance, business planning and protection services. It also offers educational materials to encourage employees to save.
- For institutional clients, PFG has specialized investment groups in a variety of asset classes.
PFG ranks high in a number of categories:
- #1 provider of defined benefit retirement plans
- #1 recordkeeper of employee stock ownership plans
- #1 provider of nonqualified deferred compensation plans
- #3 provider of group benefits insurance (dental, life, and disability)
Principal has over $700 billion in assets under management.
PFG’s capital spending is normally spread among dividends, share buybacks, and M&A activities. In response to Covid-19, the company has cut back on M&A, with its capital going largely to dividends and share repurchases in 2020.

[Source: Q2 PFG Earnings presentation]
Management has said that it may make an opportunistic, small acquisition if the opportunity develops in 2020.
PFG made a major acquisition in 2019 of Wells Fargo’s Institute Retirement & Trust business. The addition doubled PFG’s domestic footprint in retirement as measured by the number of plan participants. The company feels that the acquisition represents a decade of organic growth.
The following table shows a variety of corporate quality rankings from third parties for PFG. Morningstar awards PFG no moat, but they do not have an analyst assigned to the company. They list four competitors, and none has a moat rating, so I don’t attribute much meaning to that factor for PFG.

Overall, I give PFG a slightly above-average grade for its business quality.
PFG’s Financials
PFG gets an “A” financial grade from Value Line, their third-highest grade, a designation that the company has held since 2015. Let’s look at specific financial categories and see if we agree.
Return on Equity (ROE) is a standard measure of financial efficiency. ROE is the ratio of profits to shareholders’ equity.
The average ROE for all Dividend Champions, Challengers, and Contenders is about 15%, which is similar to the ROE for S&P 500 companies generally. The following chart shows PFG’s ROE for 2011-2019.
 [Source of all yellow-bar charts: Simply Safe Dividends]
Except for one outlier year (2017), PFG’s ROE has run in the average range recently, which is an improvement from a decade ago.
Debt-to-Capital (D/C) ratio measures how much a company depends on borrowed money. Companies finance their operations through a mixture of debt, equity (new shares), and their own cash flows.
A typical D/C ratio for a large, healthy company is 50%, meaning equal dependence on debt and equity. Debt is an indicator of financial risk. All else equal, stocks with high D/C ratios are riskier than those with low D/C ratios.

PFG’s debt record is very good, with modest debt levels beneath 20% the past few years. This is more impressive considering the major acquisition in 2019. And as noted earlier, PFG has a mid-investment-grade credit rating of A-.
Operating margin measures profitability: What percentage of revenue is turned into profit after subtracting cost of goods sold and operating expenses?
Per recent research, typical operating margins for S&P 500 companies have been in the 11-12% range.

PFG’s operating margin has run generally in the average range.
Earnings per Share (EPS) is the company’s officially reported profits per share. We want to see if a company has had years when it officially lost money, or if its earnings are steadily increasing, declining, or flat.

PFG’s earnings have all been positive in the last decade, although they have dropped each of the last three full years. Analysts are projecting a 4% drop in EPS for 2020 due to Covid-19, followed by a 17% rebound in 2021.
Free Cash Flow (FCF) is the money left over after a company pays its operating expenses and capital expenditures. Whereas EPS is subject to GAAP accounting rules, cash flow is a more direct measure of money flowing through the company. It is the cash that a company has available for dividends, stock buybacks, and debt repayment.

PFG’s cashflow record is outstanding: Positive every year for the past decade and rising for the past four pre-Covid years. The strong FCF record is one of the reasons that PFG’s dividend is comsidered to be safe.
Share Count Trend shows whether the company’s outstanding shares are increasing in number, decreasing, or remaining flat.
I like declining share counts, because the annual dividend pool is spread across fewer shares each year. By retiring its own shares, the company is investing in itself, expanding each remaining share into a larger piece of the pie, and improving all per-share statistics.

PFG has been reducing its outstanding shares steadily over the past decade. It has about 13% fewer shares now than it had 10 years ago. As we saw earlier, it is continuing to deploy capital to share repurchases even during Covid-19.
Here is a summary of the items above:

Overall, this is a good financial record, which includes some average areas and other excellent areas.
The numbers fully support Value Line’s A (3rd level out of 9) rating. My own grade would be a B- on a conventional A-F scale. The potential weak spot looking forward, obviously, is the depth and length of the negative impact of Covid-19.
PFG’s Stock Valuation
My 4-model process for valuing companies is described in Dividend Growth Investing Lesson 11: Valuation. Let’s go through the steps.
Models 1 and 2: FASTGraphs relative P/Es.
These two models compare the stock’s current price to (1) FASTGraphs’ basic estimate of its fair value, and (2) the stock’s own 5-year average valuation.

The orange line is FASTGraph’s default valuation line, based on a standard price-to-earnings ratio (P/E) of 15. The blue line is an alternative fair-value reference line, based on Principal’s own average 5-year valuation, which is 11.2.
The black line is PFG’s actual price. Since it falls well below both the orange and blue reference lines, that suggests that PFG is undervalued using both of the first two valuation models.
Valuation ratios – the ratio of the actual price to the fair price – can be easily computed. To do that, we compare PFG’s actual current P/E (7.4 as shown in the blue box) to the values used to draw the orange and blue lines. Here are the valuation ratios if we do that.
- Based on default (orange) line: 7.4 / 15 = 0.49.
- Normalized, based on historical (blue) line: 7.4 / 11.2 = 0.66
The first valuation ratio suggests a fair price for PFG is $40 / 0.49 = $82. The normalized valuation ratio suggests a fair price of $40 / 0.66 = $61.
We’ll consolidate these fair price estimates later in the summary. Let’s move on to the other valuation models.
Model 3: Morningstar Star Rating. Morningstar ignores P/E ratios. Instead, they use a discounted cash flow (DCF) process for valuation. Many investors consider DCF to be the best method of assessing stock valuations.
Morningstar creates a detailed projection of all the company’s future cash flows. Each year’s number is discounted back to the present to reflect the time value of money, then they are added up. The resulting net present value of all future cash flows is considered to be the fair price for the stock today. They update their estimates periodically.
Morningstar calculates PFG’s valuation ratio as 0.77 (circled), which leads to a fair price estimate of $52 shown at the top right.

Model 4: Current Yield vs. Historical Yield. Last, we compare the stock’s current yield to its historical yield. This approach to calculating fair value is based on the idea that if a stock’s yield is higher than normal, it suggests that its price is undervalued (and vice-versa).

PFG’s current yield is 5.6%, compared to its 5-year average of 3.7%. That gives us a valuation ratio of 0.66. However, for this model, I put a floor under the valuation ratio at 0.80, because I consider this to be the least direct model for measuring valuation. The fair price then calculates as $40 / 0.80 = $50.
Valuation Summary:

Note that even though Morningstar calculates PFG’s price to 23% below fair value, they call it “fairly valued,” so I have used that terminology here. Normally a gap that large would be undervalued. I believe their label of fairly valued is a result of their assigning PFG’s an uncertainty rating of “high, which could also be related to the fact that they have no analyst assigned to PFG and thus everything has been calculated by formula.
Miscellaneous Factors for PFG
Beta
Beta measures a stock’s price volatility relative to the S&P 500. I like to own stocks with low volatility, because they present fewer occasions to react emotionally to rapid price changes, especially sudden price drops that can induce a sense of fear. There is also academic research that suggests that low-volatility stocks outperform the market over long time periods.
PFG’s 5-year beta of 1.6 compared to the market as a whole (defined as 1.0) means that its price has moved quite a bit more than the market on average. This is a negative factor.
Analyst’s Recommendations
Thomson Reuters’ IBES database compiles Wall Street analysts’ current recommendations. This is their latest summary:

The average recommendation of “hold” is a neutral factor.
What’s the Bottom Line on Principal Financial Group?
Here are PFG’s positives:
- Good dividend resume: High yield at 5.6%; 12 straight years of increases, although that streak does not span the Great Recession of 2007-2009; and good dividend safety score.
- Slightly above-average business model and quality rating.
- Above-average financials, highlighted by low debt and strong annual cash flow. No financial warning flags.
- Steep price discount at the current time.
Here are PFG’s negatives:
- Dividend increases have slowed the past couple of years, although the small 2020 increase is understandable considering Covid-19.
- Cut dividend during the 2007-09 recession.
- High beta (1.6).
Overall, I see PFG as an intriguing candidate for a dividend-growth investor, especially one interested in an opportunity to obtain a high-yield stock, with a safe dividend, at a highly-discounted price.
That said, this is not a recommendation to buy, hold, or sell PFG. Any investment requires your own due diligence. Always be sure to match your stock picks to your personal financial goals.
— Dave Van Knapp
A Few Words About My Upcoming E-Book
In December, I will publish Top 30 Dividend Growth Stocks for 2021: A Sensible Guide to Dividend Growth Investing.
 This will be my 8th e-book on dividend growth investing. The last one was in 2014.
Please click here to learn more about the new e-book. You can join my email list for free monthly updates about the book’s progress, behind-the-scenes information about the writing process, and links to my most recent articles about dividend growth investing.
If you sign up, as a thank-you I will send you a free pamphlet that explains compounding. You incur no obligation if you sign up for the monthly updates, and the pamphlet is yours to keep.
The goal? To build a reliable, growing income stream by making regular investments in high-quality dividend-paying companies. Click here to access our Income Builder Portfolio and see what we’re buying this month.
Source: Dividends and Income