
This article first appeared on Dividends & Income on Wednesday.
Background
Honeywell International (HON) is an industrial giant founded in 1920 that operates around the world.

The company has four segments:
-
- Aerospace provides around 40% of revenue and profits. Honeywell’s products are used in virtually every aircraft platform and also in more than 100M vehicles worldwide. Products include aircraft propulsion, cockpit systems, satellite communications, and vehicle turbochargers. About a third of this business provides spare parts, repair, overhaul, and aftermarket maintenance under long-term contracts.
-
- Building Technologies contributes 20%-25% of revenue and profits. Products include controls and displays for heating, cooling, indoor air quality, ventilation, humidification, and lighting and home automation.
-
- Performance Materials and Technologies provides about 25% of revenue and profits. Products include advanced materials (additives, fibers, chemicals, etc.), process technologies, automation solutions, and industrial software for a broad swath of industrial segments.
-
- Safety and Productivity Solutions comprises about 12% of revenue and profits. Products include scanning and mobile computers, software, warehouse automation solutions, and personal protective equipment.

Quality Snapshot and Dividend Record
As explained in Dividend Growth Investing Lesson 20: Quality Snapshots, I derive Quality Snapshots from the following sources, which I have come to trust and respect over the years:
-
- Safety and Financial Strength grades from Value Line
- S&P’s Credit rating
- Morningstar’s Moat rating
- Simply Safe Dividends’ Dividend Safety grade.

On my grading system, Honeywell falls one point short of a perfect score (garnering 24 points on 25-point scale). All categories are green, and most of them are in the highest tier.
Honeywell’s yield is 2.5%, which is mid-range. The company has a 9-year streak of annual dividend increases following a one-year freeze in 2010. The company announces raises late in the year, so 2020’s raise hasn’t been announced yet.
Last year’s increase was 10%, and overall, Honeywell has a fast dividend growth pace, making it a mid-yield, fast-growth dividend stock.
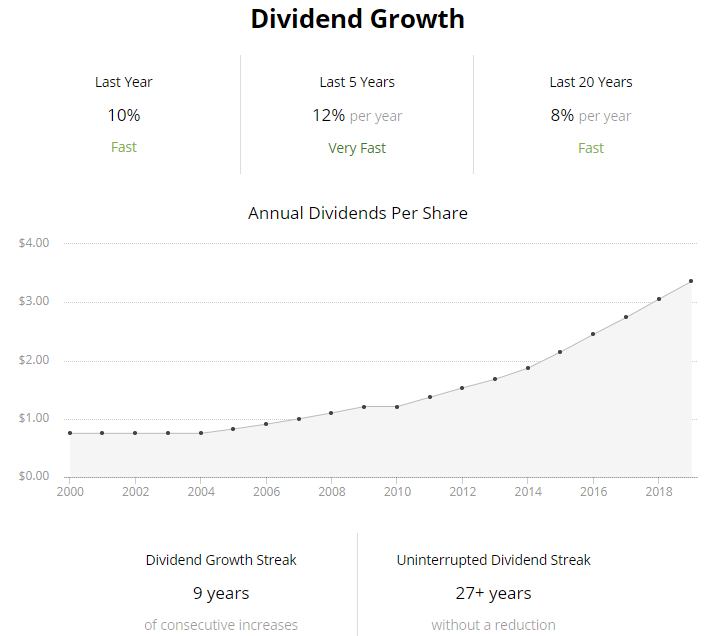
[Source: Simply Safe Dividends]
Honeywell Enters the Valuation Zone
To value a stock, I use four different valuation models, then average them. For more details on my approach, see Dividend Growth Investing Lesson 11: Valuation.
Model 1: FASTGraphs Default Valuation
The first model checks the stock’s current price against FASTGraphs’ basic estimate of its fair value.
FASTGraphs generally uses the historical average P/E ratio of the whole stock market to represent a fair valuation. That ratio is 15, and it is used to draw the orange fair-price reference line on the following graph.
The black line is Honeywell’s price. You can see that the company’s price got hammered in the early part of this year, and it has partially recovered since then.

According to this model, Honeywell is significantly overvalued.
Formula for Measuring Valuation on FASTGraphs
Valuation Ratio = Actual P/E divided by Reference P/E
Valuation Ratio = 19.2 / 15 = 1.28
That valuation ratio suggests that Honeywell is 28% overvalued. We use that ratio to calculate a fair price.
Formula for Calculating Fair Price
Actual Price divided by Valuation Ratio = Fair Price
$145 / 1.28 = $113
Model 2: FASTGraphs Normalized Valuation
FASTGraphs offers other fair-value reference lines. The one that I like is based on the stock’s own long-term valuation rather than the market as a whole. Thus, this model “normalizes” the valuation to the company’s own historical record.
In the following graph, Honeywell’s 5-year average P/E ratio (circled) is used to draw the blue fair-value reference line. The company’s price is again in black.

This model presents Honeywell as fairly valued, with its price being just above the fair-value reference line. The reason for the significant difference between the two models is that Honeywell’s 5-year average P/E ratio is 18, which is quite a bit higher than the ratio of 15 used to draw the orange line in the prior model.
Applying the formulas for valuation ratio and fair price, we get:
Valuation ratio: 19.2 / 18 = 1.07, or 7% over fair price
Fair price: $145 / 1.07 = $136
Note: I consider any price within +/- 10% of fair price to be fairly valued. Thus I think that this model suggests that Honeywell is fairly valued.
Model 3: Morningstar’s Valuation
Morningstar takes a different approach to valuation. They ignore P/E and other valuation ratios.
Instead, they construct a discounted cash flow (DCF) model. Using conservative projections, they discount all of the stock’s estimated future cash flows back to the present to arrive at a fair value estimate. The idea is that a stock’s fair price is equal to the net present value of all of the company’s future cash flows.
Here is Morningstar’s conclusion:
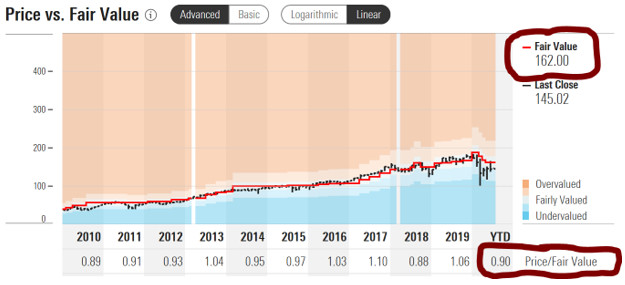
Morningstar has Honeywell with a 0.90 valuation ratio and selling at a 10% discount to its fair price estimate, which is $162.
Model 4: Current Yield vs. Historical Yield
The final model compares the stock’s current yield to its historical yield.
If a stock is yielding more than its historical average, that suggests that it is a better value than usual, because you are paying less for the stock’s dividends.
Another way to look at it is that, with a well-valued stock, you can buy more shares with your money. Because dividends are paid per share, you will get more dividends for your capital investment.
This final model suggests that Honeywell is undervalued.
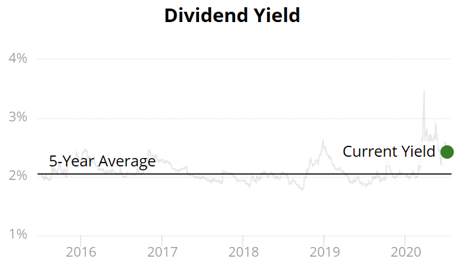
[Source: Simply Safe Dividends]
Formula for Measuring Valuation by Comparing Yields
Valuation Ratio = 5-Year Average Yield divided by Current Yield
Valuation Ratio = 2.1% / 2.5% = 0.84, or 16% undervalued
Applying the same equation for fair price as in the other models, we get a fair price of $145 / 0.84 = $173.
Honeywell’s Valuation Summary
Now we average the 4 approaches.
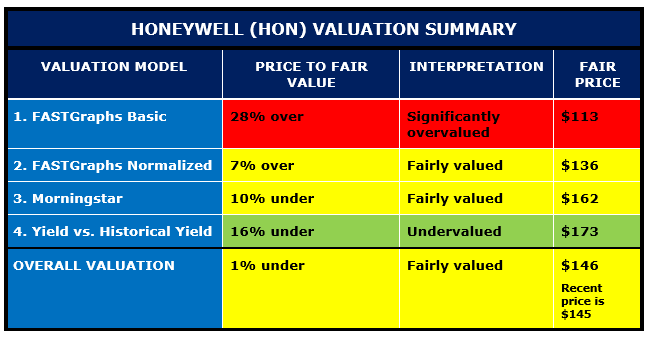
The spread between the highest and lowest models illustrates why I use several models. Each model is logical, but they come to different conclusions.
In the end, the average of the four models suggests that Honeywell is selling for a fair price.
Normally, I like to buy discounted stocks, but for a high-quality company like Honeywell (24/25 points on the Quality Snapshot scale), I will pay fair value. In fact, I would pay up to 10% above fair value, making my buy range for Honeywell up to $161.
Closing Thoughts
Honeywell has an elite Quality Snapshot, gathering 24 out of a possible 25 points. Its dividend is rated extremely safe by Simply Safe Dividends. Its yield is almost 20% more than its 5-year average.
While I normally like to buy things at a discount, “sale prices” don’t come along very often on the highest-quality stocks.
Fair price is a good price when considering the best of the best.
I do not own Honeywell, and part of the reason is that I rarely see it at a decent price.
However, Mike Nadel has purchased it twice for the Income Builder Portfolio, most recently about a year ago.
See his article here on that purchase. I know that Mike has liked the company for a long time.
I see Honeywell as a high-quality dividend growth candidate. It is especially suitable for someone who is willing to trade a lower starting yield for faster dividend growth. While that brings to mind younger people with a long time horizon, a company of Honeywell’s quality could be a good fit for almost any dividend growth portfolio.
This is not a recommendation to buy Honeywell. As always, perform your own due diligence. Check the company’s complete dividend record, business model, financial situation, and prospects for the future. Also consider your tolerance for risk and how well the company fits (or does not fit) your long-term investing goals.
Some Personal News
In December, I will publish Top 30 Dividend Growth Stocks for 2021: A Sensible Guide to Dividend Growth Investing.
This will be my 8th e-book on dividend growth investing, and my first since 2014. The book will contain lots of new material, plus of course a new analysis of 30 of the best dividend growth stocks.
Please click here to get on an email list for monthly updates on the book’s progress and a direct notification when it becomes available. If you sign up, I will send you a free pamphlet about compounding, which is one of the keys to dividend growth investing.
Thank you.
— Dave Van Knapp
The goal? To build a reliable, growing income stream by making regular investments in high-quality dividend-paying companies. Click here to access our Income Builder Portfolio and see what we’re buying this month.
Source: Dividends and Income