
This month, we analyze a relatively new member of the Dividend Champions, Contenders, and Challengers: Pinnacle West Capital Corp. (PNW). The company’s name makes it sound like a financial operation, but PNW is actually an electric utility in Arizona.
Pinnacle West has just an 8-year dividend growth streak, but it has paid uninterrupted dividends for more than 25 years. The company is quite a bit undervalued at the moment.

Pinnacle West’s Dividend Record

This is a good dividend record. Its highlights include the high yield (4.3%), fast rate of dividend growth, and excellent dividend safety rating.
PNW’s dividend growth rates have been rising. Its 1-year rate is higher than its 3-year rate, which is higher than its 5-year rate, which is higher than its 10-year rate. I love to see this pattern.

I classify Pinnacle West as a high-yield, fast-growth company. It will be interesting to see whether PNW can maintain its fast-growth record this year, with the impact of the Coronavirus pandemic on its business still playing out.
Note the very safe score from Simply Safe Dividends, based on their analysis of factors that impact dividend sustainability. They see nearly no factors to suggest that PNW will cut its dividend in the near future.
Pinnacle West’s Business Model and Company Quality
Pinnacle West Capital is a utility holding company based in Phoenix, Arizona. Its roots trace back more than 125 years.
APS is vertically integrated, and it provides both retail and wholesale electric service to most of the Arizona, with a total of 1.3 million customers. APS consists of traditional regulated retail and wholesale electricity businesses and related activities, including electricity generation, transmission, and distribution.
APS also co-owns and operates the Palo Verde Generating Station, which is a primary source of electricity for the Southwest.
As shown on this map, Pinnacle West serves much of Arizona. Arizona is one of the fastest-growing service territories in the West.

APS’s generation facilities include nuclear, gas/oil, and coal. The company has adopted a “Clean Energy Commitment” that has an aspirational goal to generate electricity with zero-carbon emissions by 2050. Nearer-term, the company has a 2030 target of 65% clean energy, with 45% coming from renewable energy. The company has committed to eliminate coal-fired generation from its portfolio by 2031.
Like many utilities, Pinnacle West has a legal effective monopoly in its service area, which is an obvious source of strength for the company.
Morningstar awards Pinnacle West a “narrow” moat rating, based on its service territory monopoly, efficient scale advantages, and regulated rates that have enabled APS to earn a fair return on its investments.

Pinnacle West’s Financials
As just seen in the table above, Value Line gives Pinnacle West its second-highest financial grade, A+. In this section, we’ll do our own analysis.
Return on Equity (ROE) is a standard measure of financial efficiency. ROE is the ratio of profits to shareholders’ equity.
The average ROE for all Dividend Champions, Challengers, and Contenders is 14%, which is the same value for S&P 500 companies. The following chart shows PNW’s ROE 2010-2019.
 [Source of all yellow-bar charts in this section: Simply Safe Dividends]
Pinnacle West’s ROE is remarkably consistent, but at a mediocre level of 10%. The level suggests that PNW is not a spectacularly efficient company, although (unlike many companies), its ROE is not goosed by high debt levels.
Debt-to-Capital (D/C) ratio measures how much a company depends on borrowed money. Companies finance their operations through a mixture of debt, equity (new shares), and their own cash flows.
A typical D/C ratio for a large, healthy company is 50%. D/C is a measure of financial risk. All else equal, stocks with high D/C ratios are riskier than those with low D/C ratios.

Pinnacle West’s reliance on debt is lower (better) than average, running below 40% for the past decade. This is a positive factor.
As noted earlier, PNW has a good investment-grade credit rating. Debt does not seem to be a problem for this company.
Operating margin measures profitability: What percentage of revenue is turned into profit after subtracting cost of goods sold and operating expenses?
Per recent research, typical operating margins for S&P 500 companies have been in the 11-12% range.

Pinnacle West’s profitability has run steadily above average over the past decade. Although it has dipped the past couple of years, PNW’s operating margin remains almost double the S&P 500 average. This is a very positive metric for PNW.
Earnings per Share (EPS) is the company’s officially reported profits per share. We want to see if a company has had years when it officially lost money, or if its earnings are steadily increasing, declining, or flat.

This is another good metric for PNW. Its reported earnings show an obvious pattern of gain over the past decade, gaining 57%. Earnings have risen on an annual basis in 7 of the past 9 years, and the two years when that did not happen registered only tiny decreases. This is one of the best earnings records among companies that I have analyzed.
Free Cash Flow (FCF) is the money left over after a company pays its operating expenses and capital expenditures. Whereas EPS is subject to GAAP accounting rules, cash flow is a more direct measure of money flowing through the company. It is the cash that a company has available for dividends, stock buybacks, and debt repayment.

As with most utilities, Pinnacle West shows a jagged FCF record. However, it is generally accepted that a utility’s earnings are more insightful than its free cash flow.
That is because utilities have a capital-intensive business model that requires large investments with long payback periods. They issue debt and equity to fund these projects. In PNW’s case, they expended $1.21 billion in 2019 and project $1.33 billion in capital expenditures in 2020. Major spending areas include clean generation (35%), and distribution and transmission (44%).
In that context, the facts that PNW has relatively low debt and (as we will see) a flat share count over the years throws a positive light on their finances.
Share Count Trend shows whether the company’s outstanding shares are increasing in number, decreasing, or remaining flat.
I like declining share counts, because the annual dividend pool is spread across fewer shares each year. By retiring its own shares, the company is investing in itself, expanding each remaining share into a larger piece of the pie, and improving all per-share statistics.
Next-best is a flat share-count record, which means that the company is not issuing many dilutive new shares to finance itself. That describes Pinnacle West’s record, with a very steady share count (slight increase) over the past 9 years.

Here is a summary of the items above:

Pinnacle West’s financial picture, overall, is quite good. I have no quarrel with Value Line’s A+ grade, which is their 2nd-highest of nine grade levels. PNW has maintained that rating since 2014.
Pinnacle West’s Stock Valuation
The quality of a company is one thing. The valuation of its stock is another. We want to buy stocks that are undervalued whenever possible. I use four valuation models, then average them out.
Model 1: FASTGraphs Basic. The first step is to compare the stock’s current price to FASTGraphs’ basic estimate of its fair value.
The basic model creates a fair-value reference line based on a price-to-earnings (P/E) ratio of 15, which is the historical long-term P/E of the stock market.
In the following chart, the fair-value reference line is orange, and the black line is PNW’s actual price. I circled PNW’s current P/E ratio, which is 14.9.
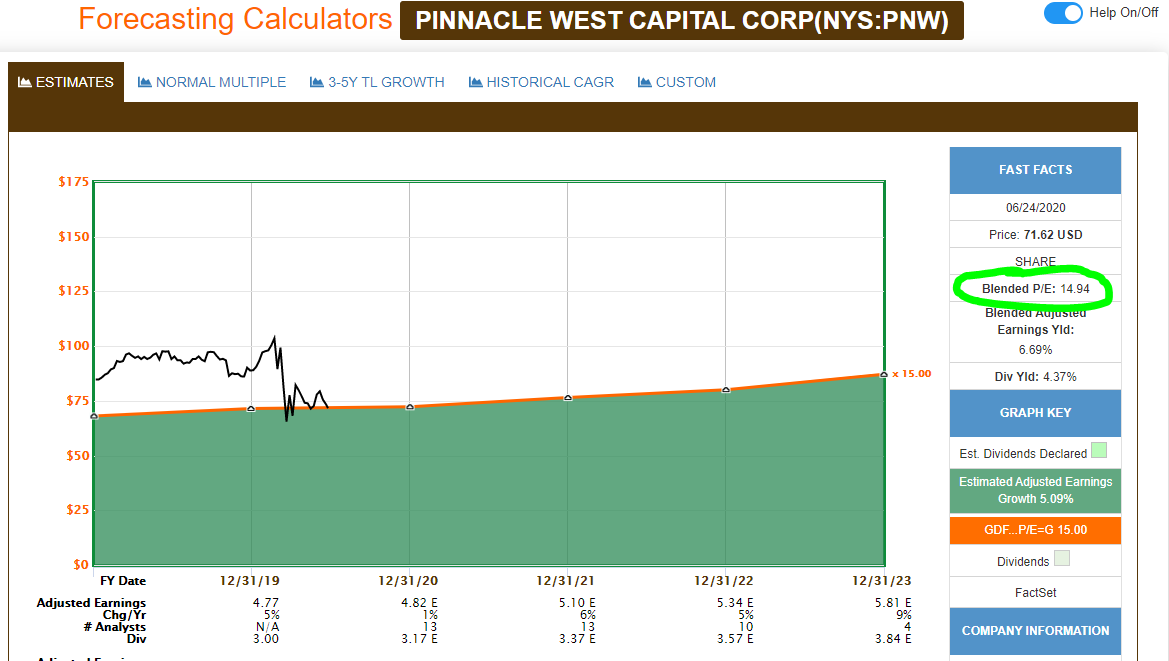
Since the black price line is practically right on the orange reference line, Pinnacle West is fairly valued according to this model.
To calculate the slight degree of undervaluation, we make a ratio of the actual P/E to the reference P/E.
Calculating Valuation Ratio from FASTGraphs
Actual P/E ratio / Reference P/E ratio
14.9 / 15 = 0.99
That suggests that PNW is undervalued by 1%.
We calculate the stock’s fair price by dividing the actual price by the valuation ratio. That gives us $72 / 0.99 = $73 for a fair price.
Model 2: FASTGraphs Normalized. In the second valuation model, we compare PNW’s current P/E to its own 5-year average P/E.
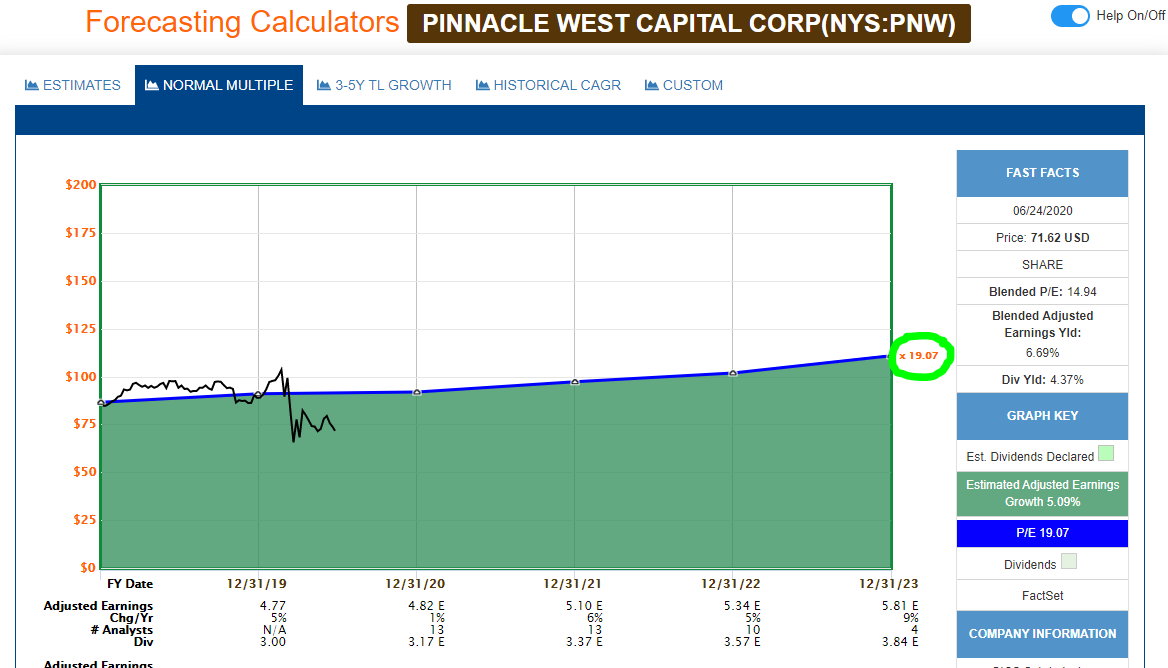
The reference line is now blue, and this model paints a different picture of Pinnacle West’s valuation, because PNW’s 5-year average P/E has been 19.1. That shifts the fair-value reference line up to where it is significantly above PNW’s current price.
Using the same formulas as in the first step, we get:
- Valuation ratio = 14.9 / 19.1 = 0.78, suggesting 22% undervaluation
- Fair price = $72 / 0.78 = $92
Step 3: Morningstar Star Rating. Morningstar takes a different approach to valuation. They do not use P/E or other valuation ratios. Rather, they use a discounted cash flow (DCF) model. DCF is based on the idea that a company is worth all of its future cash flows, discounted back to the present to reflect the time value of money.
Obviously, no one actually knows a company’s future cash flows. Estimates must be used. My experience with Morningstar is that they have a thoughtful, comprehensive, and conservative process for determining the inputs that they use in their DCF formulas.
Here is Morningstar’s valuation of PNW going back 10 years. I have circled their current assessment.

Morningstar rates Pinnacle West as undervalued by 19%, and they calculate a fair price of $89.
Step 4: Current Yield vs. Historical Yield. My last model compares the stock’s current yield to its historical yield. This relative-yield method of estimating fair value is based on the idea that if a stock’s yield is higher than usual, it may indicate that its price is discounted, because price and yield are inversely related.
This chart shows Pinnacle West’s current yield (green dot) compared to its 5-year average yield (black horizontal line).
 [Source: Simply Safe Dividends]
PNW’s current yield of 4.4% is 29% above its 5-year average yield of 3.4%.
Calculating Valuation Ratio by Comparing Yields
5-Year Average Yield / Current Yield
3.4% / 4.4% = 0.77
When I use this model, I put a “floor” under the valuation ratio at 0.8, because I think this is the most indirect method of the four models to gauge valuation.
Using 0.8 as the valuation ratio, the fair price under this model is $72 / 0.80 = $90.
Valuation Summary:

Pinnacle West registers as discounted under three of the four models, and those three are within a few bucks of each other as to PNW’s fair price.
The average of the four models suggests a 16% discount and fair price of $86 for Pinnacle West.
Miscellaneous Factors
Beta
Beta measures a stock price’s volatility relative to the S&P 500. I like to own stocks with low volatility for two reasons:
- They present fewer occasions to react emotionally to rapid price changes like price drops that can induce a sense of fear.
- There is research that suggests that low-volatility stocks outperform the market over long time periods.
Pinnacle West’s 5-year beta is 0.35, which means its volatility has been, on average, far less than the market’s. This is a positive factor.
Analyst’s Recommendations
In their most recent report on BMY, CFRA gathered the recommendations of 16 analysts covering the stock. Their average recommendation is 3.4 on a 5-point scale, where 3 = hold and 4 = buy. This is a neutral factor.

The Bottom Line
Pinnacle West’s positives:
- Good dividend resume: 4.4% yield (well above 5-year average); rising rate of dividend growth per year for several years, although 2020 is not accounted for yet; and excellent dividend safety score of 92 out of 100 points.
- Successful electric utility that supplies most of Arizona. Legal monopoly with most of revenue covered by regulations. Clean energy commitment to move to carbon-free generation over several decades.
- Good to Excellent business quality ratings across the board.
- Solid financials highlighted by high profit margins, moderate debt, steadily positive and rising earnings, and good investment-grade credit rating.
- Very low price volatility.
- Shares are 16% undervalued.
Pinnacle West’s negatives:
- Short dividend increase streak (8 years), although dividends have been paid for more than 25 years.
- Moderate ROE, although that is balanced by moderate debt and overall favorable financials.
- Coronavirus/covid conditions make all projections for any business at least somewhat speculative at this time.
In my opinion, at its current pricing, Pinnacle West is an attractive dividend-growth opportunity. In fact, assuming its shares stay undervalued, it will be on my short list for the next reinvestment in my Dividend Growth Portfolio.
Nothing in this article is intended to be investment advice. This is not a recommendation to buy, hold, or sell Pinnacle West Capital. Always perform your own due diligence. Check the company’s complete dividend record, business model, financial situation, and prospects for the future. Also consider how well it fits (or does not fit) your own long-term investing goals.
Some Personal News
I am writing my first new e-book about dividend growth investing since 2014.
Its title will be Top 30 Dividend Growth Stocks for 2021: A Sensible Guide to Dividend Growth Investing.
With the help of my colleagues at Daily Trade Alert, we have created a website for the new e-book, including descriptions of the book, background information on dividend growth investing, a countdown clock, and progress report.
Please click here for more information about this project. Publication is expected in December.
Thank you.
— Dave Van Knapp
The goal? To build a reliable, growing income stream by making regular investments in high-quality dividend-paying companies. Click here to access our Income Builder Portfolio and see what we’re buying this month.
Source: Dividends and Income