Utility stocks should be primarily thought of as income investments. To a certain extent they can be considered as bond alternatives. Not bond replacements, instead, an alternative income producing asset that has advantages and disadvantages over fixed income and common stocks in general.
For starters, most utility stocks are regulated and therefore operate with government regulatory protection. Frankly, this is both a negative and an advantage. The negative is that the regulatory environment that the utility operates in can have a major impact on how well they can perform as a business and therefore how well they can serve their shareholders.
On a more positive note, they also operate with government regulatory protection serving as a barrier to entry that protects them from competitors. Being regulated also produces a level of stability and predictability that unregulated companies do not have.
However, although utility stocks can provide a growing income stream, and if purchased at sound valuation some capital appreciation potential, their growth rates tend to be low relative to other companies.
In the same vein, utility stocks tend to be resistant, not immune, but resistant to economic cycles because demand for utilities does not change very much even during recessions. People need to heat their homes in the winter and cool their homes in the summer. They might turn their thermostats up or down accordingly, but they rarely turn them off.
However, potential investors should also be cognizant of the reality that the growth rates of regulated utility stocks are controlled, and to an extent restricted. Consequently, when considering investing in utilities, their low rates of growth heighten the necessity to be very disciplined with valuation that is greater than it is for most companies operating in other more opportunistic industries.
In summary, many investors consider utility companies as conservative noncyclical investments with low volatility while providing an inflation hedge over fixed income alternatives like bonds. Consequently, the general stability of the revenues of a regulated utility coupled with their above-average and modestly growing dividend yields make them especially suitable for investors living off the income their portfolios provide.
Nevertheless, despite these general characteristics, it is important that prospective investors also recognize that it is a market of utility stocks just like it is a market of stocks. In other words, some utility stock investments are better than others.
OGE Energy Corp (OGE).
The following profile is taken directly from OGE energy Corp.’s website:
“OGE Energy Corp. (NYSE: OGE), is headquartered in Oklahoma City and is the parent company of Oklahoma Gas and Electric Company (OG&E), a regulated electric utility. OGE holds 25.5 percent limited partner interest and 50 percent general partner interest in Enable Midstream Partners, LP.
OG&E serves more than 858,000 customers in Oklahoma and western Arkansas, with an electric transmission and distribution system that spans 30,000 square miles. With approximately 7,081 megawatts of capacity, OG&E generates electricity from natural gas, low-sulfur coal, wind and solar. We work diligently to enhance the customer experience, while ensuring our rates remain low, currently more than 30% below the national average. Low rates and high customer satisfaction are significant competitive advantages as we seek to grow our customer base.”
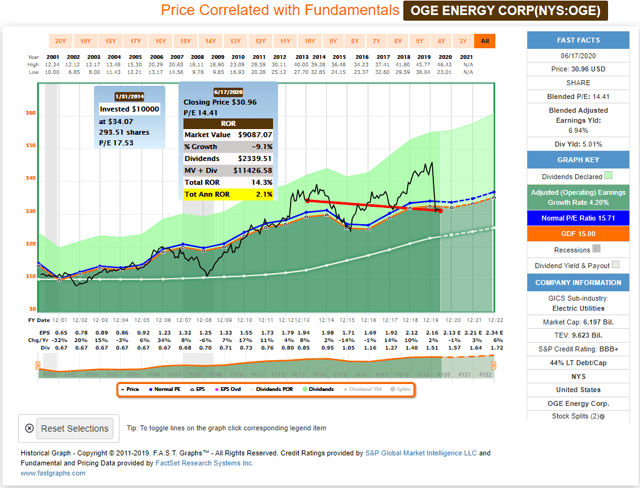
As the following adjusted (operating) earnings and price correlated FAST Graph illustrates, OGE Energy has grown earnings at an average rate of 4.2% since 2001. Although earnings have been moderately cyclical at times, the company did remain profitable during both the 2001 and the 2008 recessions. Moreover, the company’s dividend was stable and even grew moderately during the great recession of 2008.
Most importantly, as I alluded to in the introduction, investors must be very disciplined with valuation when considering utility stocks. For the most part, from 2013 to the end of last year, OGE was overvalued – as were most utilities during this timeframe. As a result, the company did not perform very well as illustrated in the pop up on the graph. The main culprit was excessive valuation which reduced the yield and eventually led to a modest capital loss as the company inevitably reverted to its mean valuation.
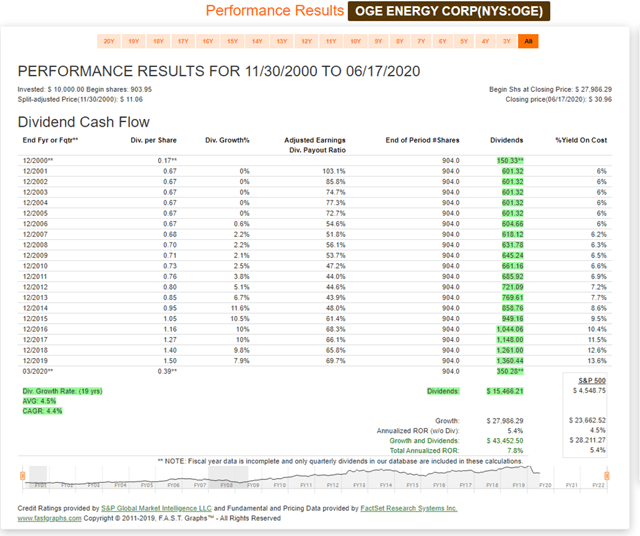
From a longer-term perspective, the attributes I discussed about utility stocks in the introduction prove true for OGE shareholders since November 2000. This slow growth utility slightly outperformed the S&P 500 on a capital appreciation basis of 5.4% annual growth versus 4.5% for the S&P. However, the star of the show was the total cumulative dividend income received. On this basis, OGE produced more dividend income than the market by a factor greater than 3 to 1.
On the other hand, the reader should also note that although the dividend record has been quite stable since November 2000, it was frozen for the first 5 years. Following that, dividend growth was very modest through 2010, but then accelerated from there going forward.
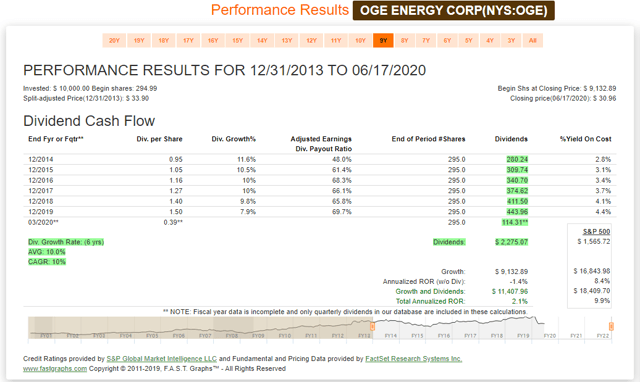
Although we can learn a lot by examining the past record, we must remember that we can only invest in the future. Therefore, even though OGE has been increasing its dividend at double-digit rates since 2014 (10% average) Morningstar forecasts that future dividend growth rates will be closer to 4% over the next 5 years. This lower rate of dividend growth is attributed to the combined effects of the economic impact of COVID-19 coupled with the 50% distribution reduction from Enable which is attributed to the recent energy crisis. Nevertheless, current attractive valuation and above-average dividend yield represent mitigating factors.
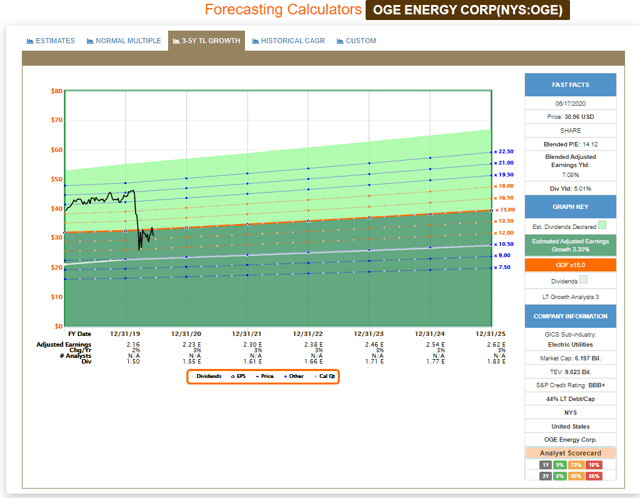
Morningstar’s dividend growth forecast would be consistent with the long-term consensus analyst estimates provided by FactSet. Furthermore, Morningstar in their most recent analyst note points out that the Oklahoma Corporate Commission has historically represented a below-average regulatory framework, although that appears to be improving. As Morningstar reported:
“In September 2019, the Oklahoma Corporate Commission approved a settlement for environmental upgrades at the Sooner coal-fired plant and natural gas conversions of coal units at the Muskogee coal plant. Wholly owned Oklahoma Gas & Electric had been seeking approval for these investments for a decade. We consider the approval a sign that Oklahoma regulation is improving, albeit slowly.”
Morningstar also cited OGE’s proposed $810 million grid modernization plan that they presented to the Oklahoma Corporation commission in February 2020. According to Morningstar, if this proposal was approved it would reduce regulatory lag suggesting that Oklahoma regulation may be becoming more constructive. This represents both a risk and an opportunity in my opinion.
OGE Energy Corp. Diluted (GAAP) Earnings And Price Correlation
Although I generally prefer valuing a stock based on adjusted earnings because they are more representative of how the business is doing, OGE’s stock price has been highly correlated to their diluted (GAAP) earnings. I consider this earnings metric important because of the capital-intensive nature of utility companies in general and OGE specifically.
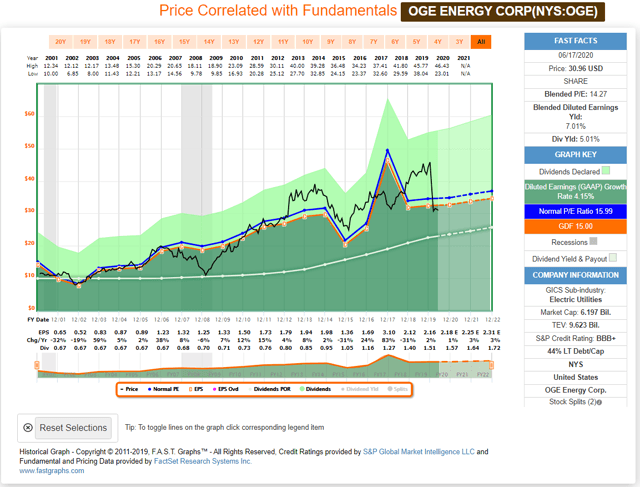
The most important takeaway from the earnings and price correlated graphs above is that valuation has now become both prudent and reasonable. Therefore, if an investor were looking for above-average dividend yield, then I would recommend looking deeper into OGE with its dividend yield in excess of 5% currently.
OGE – A Deeper Dive Into Fundamentals
Although I do consider OGE to be a high-quality utility stock, there are additional considerations regarding utility stocks in general that investors need to consider. In general, utility stocks tend to produce very stable and even strong operating cash flows. As evidenced by the FUN (fundamental underlying numbers) Graph below, OGE’s operating cash flow significantly covers the company’s dividend.

However, prospective investors need to also consider that OGE – like most utilities – are very capital-intensive businesses. The following capital expenditures expressed in millions of dollars supports that statement.

When you compare capital expenditures (CAPX) to operating cash flow (OCFL) over the past decade, you discover that there are many years where capital expenditures exceed operating cash flow. This is important and places a spotlight on what I believe is an important risk when relying on utility stocks for dividend income.

With this next graphic, I show free cash flow (FCFL) relative to capital expenditures. Free cash flow can be summarized as operating cash flows minus capital expenditures. Therefore, the reader should note from the above graph that when capital expenditures exceeded operating cash flow, OGE’s free cash flow turns negative.
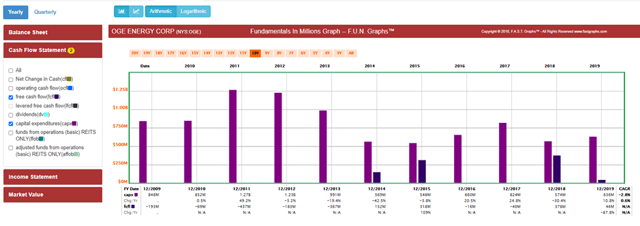
When you compare free cash flow to dividends since 2009, we discover that dividends were always greater than free cash flow. On the other hand, we also see many years where dividends were paid despite a dearth of free cash flow. Therefore, a lack of free cash flow does not directly equate to the elimination of dividends, but if you compare the lack of free cash flow to the dividend growth rates shown in the performance graphics above, we do see a significant reduction in dividend growth.

Another negative that was pointed out in the Zacks Investment Research note are the unfavorable financial ratios of OGE. In particular, Zacks Investment Research pointed out this reason to sell:
“Additionally, the company’s debt-to-capital ratio of 0.50 (FUN graphs show .47) as of Mar 31, 2020 increased sequentially from 0.44 and was also the highest in the last four quarters. Its current ratio of 0.61 at the end of first-quarter 2020 also declined sequentially and was the lowest in the past four quarters.” This is illustrated in the graphic below:

“Further, the fact that the current ratio came in less than 1 indicates that the company might not have sufficient capital on hand to pay off its debt. Such unfavorable financial ratios of OGE Energy might have caused investors to lose confidence in the stock, which was reflected in its price performance.”

On the other hand, Zacks Investment Research also pointed out that OGE is the largest electric utility in Oklahoma and in combination with its midstream gas business suggest that this somewhat mitigates the risk and suggests this as a reason to buy. As additional reasons to buy, Zacks points out the company’s grid enhancement plan referenced earlier, as well as the fact that OGE’s current business strategy has reduced carbon dioxide emissions by over 40% since 2005.
Additionally, nitric oxide levels were reduced by approximately 75% and sulfur dioxide emissions reduced by 90% since 2005. This is consistent with OGE’s record of deploying more and more renewable energy sources that do not emit greenhouse gases.
Summary and Conclusions
Utility stocks have long been considered good investments in low interest rate environments because they provide a consistent dividend income stream. On the other hand, at the same time, this had caused most high-quality utility stocks to being significantly overvalued in recent years. However, that is beginning to change as evidenced by the current valuation of OGE specifically.
Therefore, I offer this utility stock as an interesting research candidate for investors looking for above-average yield in the context of today’s low interest rate environment. Although utility stocks should not be thought of as bond or fixed income replacements, they can be thought of as rational alternatives. Therefore, I offer OGE as an attractively valued utility stock because of its recent price correction.
— Chuck Carnevale
With so many strange events happening across the economy (longest bear market for bonds since Civil War... unprecedented bank closures... and soaring prices) - it's no wonder the richest investors are loading up on gold. But what you might not realize is there's a much better way to profit from rising gold prices - without ever touching an ETF, mining stock, or even bullion. Full details here.
Source: FAST Graphs

