Last July, I analyzed Qualcomm (QCOM) as a Dividend Growth Stock of the Month.
Qualcomm is one of a handful of technology companies that have matured into dividend growth stocks. Others are Cisco (CSCO) and Microsoft (MSFT).
Qualcomm was formed in 1985 and taken public in 1991. Headquartered in San Diego, Qualcomm develops, licenses, and continually upgrades the digital communication technology called CDMA (Code Division Multiple Access).
[ad#Google Adsense 336×280-IA]In 1999, a version of CDMA was recognized and accepted as the industry standard “3G” (3rd generation) wireless technology.
Today all 3G networks are based on CDMA.
In addition to the revenue it gets from licensing its intellectual property to wireless device makers, Qualcomm is also the world’s largest manufacturer of wireless chips.
It supplies handset makers with cutting-edge microprocessors.
When I wrote the article last July, Qualcomm was undervalued. I estimated that it was selling for 23% less than its fair price. I did not own Qualcomm at that time, but I have since included it in the Dividend Growth “ETF” portfolio at Motif Investing, which I own.
My interest in re-evaluating it now is because it is a candidate for addition to my Dividend Growth Portfolio. My accumulated dividends there just surpassed the $1000 trigger level for reinvestment.
Qualcomm is highly rated for its dividend’s safety. Simply Safe Dividends gives the company a score of 88 for dividend safety, meaning that its dividend is considered to be very safe.
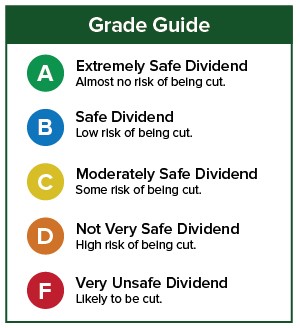
 Similarly, Safety Net Pro gives QCOM a dividend safety grade of B, which means that the dividend has a low risk of being cut.

 Let’s go through our valuation steps and see how Qualcomm stacks up.
For a complete discussion of how I value stocks, please consult Dividend Growth Investing Lesson 11: Valuation.
Step 1: FASTGraphs Default Valuation
In the the first step, we compare the stock’s current price to FASTGraphs’ basic estimate of its fair value. That basic estimate is derived from a comparison of the stock’s price-to-earnings (P/E) ratio to the historical average P/E ratio of the whole stock market, which is 15. That fair-value reference is shown by the orange line on the following graph, while the black line is QCOM’s actual price.
 As you can see, Qualcomm recently had a price drop, which took it to a more attractive price for new buyers. How much is the undervaluation? We answer that by comparing the stock’s actual P/E ratio of 12.3 (shown at the upper right) to the ratio of 15 that was used to draw the orange line.
We get 12.3 / 15 = 0.82. In other words, Qualcomm is trading at a discount of 18% as computed by this first method of valuation.
We can calculate its fair price by dividing its current price by the ratio 0.82. That’s $55.48 / 0.82 or about $68. (I round fair-value estimates off to the nearest dollar to avoid creating a false sense of exactitude.)
Step 2: FASTGraphs Normalized Valuation
In the second step, we compare Qualcomm’s current P/E ratio to its own long-term average P/E ratio. In other words, instead of judging fair valuation by how the market has valued all stocks over many years, we judge it by how the market historically has valued QCOM itself.
 Using this method, Qualcomm looks even more undervalued.
Its 10-year average P/E ratio has been 17.5, shown in dark blue.
[ad#Google Adsense 336×280-IA]That represents fair value based on QCOM’s historical treatment by the stock market.
As you can see, QCOM’s actual price falls far below the blue fair-value reference line.
As before, we can compute the degree of undervaluation by comparing QCOM’s present P/E ratio to its historical average: 12.3 / 17.5 = 0.70.
In other words, this suggests that Qualcomm is 30% undervalued.
QCOM’s fair price using this valuation method is $79.
Step 3: Morningstar Star Rating
The next step is to see what Morningstar has to say.
Morningstar takes a different approach to valuation. They ignore P/E ratios. Instead, they use a discounted cash flow (DCF) model. They discount all of the stock’s future cash flows back to the present to arrive at a fair value estimate.
When this technique is done right, many investors consider it to be the finest way to value a stock.
![]() Morningstar gives Qualcomm 4 stars on a 5-star scale. They too believe that the stock is undervalued. They have computed a fair price of $68.
Morningstar gives Qualcomm 4 stars on a 5-star scale. They too believe that the stock is undervalued. They have computed a fair price of $68.
Step 4: Current Yield vs. Historical Yield
As a fourth valuation method, we compare the stock’s current yield to its historical yield. The more that the stock’s current yield is above its historical average, the better value it represents.
Qualcomm’s current yield is 3.8%. According to Morningstar, its 5-year average yield is 2.5%. Thus under this method, QCOM is undervalued. The ratio of its current yield to its 5-year average yield is 1.52. However, when I use this method, I cut off the ratio at 1.2, because there is more noise in this data.
QCOM’s fair price at a 20% undervaluation is $67.
Averaging the 4 Valuation Steps
Using the 4 approaches just described, our valuation for Qualcomm comes out like this.
 Interestingly, the 23% undervaluation now is the same percentage undervaluation that I found last July. Since then, QCOM’s price has gone up about $3 (6%) per share, even after the recent price drop.
Qualcomm’s next dividend has already been declared. The ex-dividend date is March 1, and the dividend is payable on March 22.
Qualcomm is expected to announce its next dividend increase in April, payable in June.
As always, this is not a recommendation to buy Qualcomm. Always perform your own due diligence. Check out the company’s quality, financial position, business model, and prospects for the future. Also consider whether it fits (or does not fit) into your portfolio in terms of diversification and your long-term investing goals.
— Dave Van Knapp
[ad#wyatt-income]