 When I first got into the financial industry, I was an assistant on a trading desk, eventually working my way up to trader.
Before I knew how to analyze a company by reading balance sheets and income statements, I learned about stock charts.
Two key concepts in reading stock charts are:
- The trend is your friend.
- A trend in motion stays in motion.
[ad#Google Adsense 336×280-IA]Essentially, what these two concepts mean is that a stock will continue moving in the same direction until it doesn’t any more.
How’s that for insight?
But when you look at the chart of a stock that’s heading higher, although there are some minor corrections, it often moves on a diagonal line (called a trend line) upward.
Stocks traveling along one of these trend lines usually continue until something changes their direction.
The cause of the change of direction could be a bad earnings report, weak economic data, or a large institution selling its shares. Frequently, once the trend is broken, the stock will reverse. Investors who trade using chart data look for opportunities to buy shares of stocks that are trending higher. I bring this up because the same can be said about companies that raise their dividends.
The Levels of Perpetual Dividend Raisers
Typically, a company with an established trend of increasing their dividends will raise them again next year and the year after that and the year after that . . . unless it becomes impossible to do so.
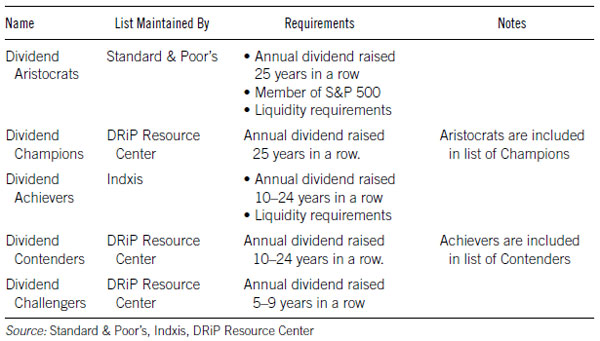
Management knows that investors have come to expect the dividend boost every year and any change in that policy will send them running for the exits. I call these companies “Perpetual Dividend Raisers,” and they come in more than one variety, as seen in the chart below.

You might automatically think that you should stick with Aristocrats and Champions because of their long-term track record. After all, with a 25-year (or more) history of boosting the dividend, the company is probably more likely to continue to raise the dividend than one with just a five-year record.
Typically, fewer than 10% of Champions fail to raise the dividend in any given year, while roughly 15% of Contenders and Challengers do not boost the dividend.
Maturity vs. Growth
However, it’s important to understand that because Champions are either more mature or have more mature dividend programs, their yields and dividend growth rates are often lower than those of Contenders.
For example, as of the end of 2011, the average yield for a Champion was 2.94% versus 3.1% for a Contender and 3.36% for a Challenger. The most recent average dividend increases were 7.24%, 8.47%, and 10.99% respectively. The current growth rates are lower than their average 10-year growth rates as companies are undoubtedly still smarting from the recession.
The difference seems small, but gets magnified as the years go on. As you can see from the table below, if you invest in the average Champion, and each year the dividend grows by the same amount as in 2011, after 10 years your dividend yield would be 5.5%.

In the case of the Contender, your yield would increase to 6.4%. If your original investment was $10,000, based on the given assumptions, in 10 years you’d collect $4,592 in income with the Contender and $4,108 from the Champion.
The Challengers, with their much higher dividend growth rates, blow away their more-mature peers. After 10 years, the dividend yield surges to 8.6%, and the investor would have collected $5,615 in income.
Less Risk Typically Equals Less Reward
As with most investments on Wall Street, the seemingly safer investment typically offers a lower yield and growth prospects. (In this particular situation, I’m talking about dividend growth, but often, share price growth is also less for safer companies than those with more risk.)
Investors have to weigh their need for safety against their need for income or growth. From the statistics just cited, you might automatically think that investing in the Challengers is the better way to go.
After all, they offer a higher yield and higher dividend growth rate. Besides, for the most recent dividend increases, their one-, three-, five- and 10-year dividend growth rates are higher, as well.
However, you need to take into account survivorship – the fact that the companies we’re examining are the ones that did not get dropped from the list of Challengers. In other words, there are some companies that you may have invested in years ago, expecting a never-ending increase in the dividend, that were cut because they failed to raise the dividend.
For example, up until February 2009, financial services firm F.N.B. Corp. (NYSE: FNB) had a 35-year history of raising its dividend. In the 10 years prior, the company grew its dividend by an average of 7.8% per year.
However, in August 2008, after 35 straight years of dividend boosts, the company kept its $0.24 quarterly dividend the same as it was in the previous year and in February 2009 cut the dividend in half, where it remains today.
So F.N.B is no longer calculated in any growth rate or total return figures pertaining to Dividend Champions.
In my book, Get Rich with Dividends, I show that the odds are in your favor that your company will continue to raise the dividend each and every year – especially after you learn what to look for in a stock to ensure the safety of the dividend.
Good Investing,
Marc
Editor’s Note: This article is an edited excerpt from Marc’s bestselling book Get Rich with Dividends. To find out more about each type of Perpetual Dividend Raiser and exactly what to look for in a stock to ensure the safety of the dividend, check out his book on Amazon.
[ad#stansberry-ps]
Source: Investment U
