
Wells Fargo (WFC) has been in the news over the past couple of years for some bad reasons.
The biggest bad reason is the scandal surrounding the bank’s opening of millions of accounts that were not authorized by the account holders. Wells’ employees did this to meet unrealistic targets for cross-selling products.
The unearthing of the scandal and WFC’s dysfunctional sales environment led to the resignation of Wells’ CEO and the firing of several executives, not to mention the prior firing of thousands of employees over the years.
In the 10-year price chart, we can see:
• WFC’s price collapse during the 2008-2009 Great Recession
• Steady price recovery from 2012-2015
• Another price reversal as the sales scandal was unravelling in 2015
• Price recovery early this year as the scandal was brought under apparent control
 At the time of the Great Recession, Wells was a “too big to fail” bank that received billions in government assistance. At that time, it cut its dividend. The bank was not able to resume increases until it received government permission. At the time of the cut, WFC had an 18-year string of annual dividend increases.
 [Source: Simply Safe Dividends]
In 2011, WFC restarted its streak of dividend raises, including a 2.6% increase this year that has already been announced and will be payable in September. Wells Fargo is thus a Dividend Challenger with a new streak of 7 years.
Dividend Safety
I like to kick off these valuation articles by confirming the company’s dividend safety. I only want to invest in companies whose dividends are safe.
For a more complete discussion of dividend safety and reliability, see Dividend Growth Investing Lesson 17: Dividend Safety.
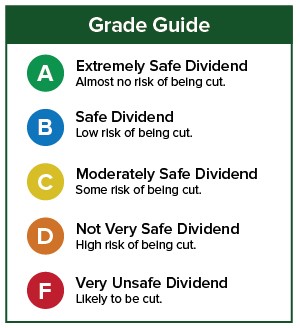
I use two services to assess dividend safety. The first is Simply Safe Dividends. They use the following scale to score dividend safety:
 Here is how Simply Safe Dividends scores Wells Fargo:
 Simply Safe Dividends’ score of 66 out of a possible 100 points for dividend safety suggests that the dividend is safe and unlikely to be cut.
Safety Net Pro gives WFC a similar grade. They use the following scale to score dividend safety:
 Here is how Safety Net Pro scores WFC:
 Now let’s proceed to our valuation steps and see how the company’s stock stacks up in terms of fair price.
Valuation Steps
To value a stock, I employ 4 methods and then average them out. For a complete discussion of my process, please read Dividend Growth Investing Lesson 11: Valuation.
Step 1: FASTGraphs Default Valuation
In the the first step, we check the stock’s current price against FASTGraphs’ basic estimate of its fair value.
For its basic estimate, FASTGraphs compares the stock’s actual price-to-earnings (P/E) ratio to the historical average P/E ratio of the whole stock market, which is 15.
That fair-value reference is shown by the orange line on the following graph, while the black line is Wells Fargo’s actual price.
 The black price line is below the orange fair-price line, because WFC currently has a P/E ratio under 15.
[ad#Google Adsense 336×280-IA]That suggests that WFC is undervalued.
How much? That’s easy to calculate.
We divide the stock’s actual P/E ratio of 13.5 (shown at the upper right) by the ratio of 15 that was used to draw the orange line.
We get 13.5 / 15.0 = 0.90.
Translating that to 90%, this step suggests that Wells Fargo is 10% undervalued.
I call that “fair” valuation, because valuation is inherently imprecise, so I rate any value within +/- 10% is “fair.”
We can calculate Wells Fargo’s fair price in dollars by dividing its current price by 0.90. That’s $55.56 / 0.90 or about $62. I round fair-value estimates off to the nearest dollar to avoid creating a false sense of precision.
Step 2: FASTGraphs Normalized Valuation
In the second step, we compare WFC’s current P/E ratio to its own long-term average P/E ratio. By doing this, we judge fair value by recognizing how the market has historically valued Wells Fargo itself rather than by how the market has valued all stocks over many years.
 This step also suggests fair valuation. That’s because WFC’s average valuation looking back 10 years has been P/E = 13.6 (see the dark blue box in the right panel). That’s almost identical to its current P/E of 13.5.
Using the same equation as in the first step, we get a fair value price of 13.5 / 13.6 x $55.56 = $55 per share.
Step 3: Morningstar Star Rating
The next step is to see what Morningstar has to say.
Morningstar ignores P/E ratios. Instead, they use a discounted cash flow (DCF) model. They discount all of the stock’s projected future cash flows back to the present to arrive at a fair value estimate. (If you would like to learn more about how this works, check out this excellent explanation at moneychimp.)
Morningstar’s ratings scale goes from 1 star to 5 stars. Morningstar states that 3-star stocks should offer a “fair return” (one that adequately compensates for the riskiness of the stock). 5-star stocks are very undervalued, while 1- and 2-star stocks have lower expected returns going forward from their current price, because they are overvalued.
Morningstar’s also rates the certainty or uncertainty of calculating a fair value. The less certain a stock’s fair value, the wider margins Morningstar requires to award more stars. Stocks with greater certainty about fair value can gain more stars with a narrower difference to fair value.

![]() Morningstar thinks that WFC has a “medium” uncertainty of fair value. They award WFC 4 stars, which means that they think that Wells Fargo is undervalued. Their fair price estimate is $67, which is about 21% more than WFC’s current price.
Morningstar thinks that WFC has a “medium” uncertainty of fair value. They award WFC 4 stars, which means that they think that Wells Fargo is undervalued. Their fair price estimate is $67, which is about 21% more than WFC’s current price.
Step 4: Current Yield vs. Historical Yield
Finally, as a 4th valuation method, we compare the stock’s current yield to its historical yield. If a stock is yielding more than its historical average, that suggests that it is a better value than usual.
Wells’ Fargo’s current yield is 2.7%. According to Morningstar, its 5-year average yield is 2.5%. Thus WFC’s yield is 8% higher than its 5-year average. That’s within the 10% band around WFC’s fair value, so again I call that fairly priced.
Doing the math, we get a fair price estimate in dollars of $55.56 / 0.92 = $60.
Valuation Summary
Using the approaches just described, our valuation for Wells Fargo comes out like this.
 The average of the 4 fair-value price estimates is $61 compared to WFC’s actual price of about $56. That’s an 8% discount to fair value, which I call “fair” as it is within the 10% range that I described earlier.
Disclosure and Caution
I do not own Wells Fargo. The fact that the stock’s valuation is favorable does not mean that I would select it for my own portfolio. A fuller analysis would be required. I do see a couple of positives just from looking at FASTGraphs:
• Good credit rating (A)
• Healthy estimated earnings growth rate (7.5%)
As always, this is not a recommendation to buy Wells Fargo. Perform your own due diligence. Check out the company’s dividend record, quality, financial position, business model, and prospects for the future. Also consider whether it fits (or does not fit) your long-term investing goals.
— Dave Van Knapp
[ad#agora]