Tanger Factory Outlets (SKT) is one of the 29 stocks in the Dividend Growth “ETF” that we kicked off in January. It is a Real Estate Investment Trust (REIT).
Tanger pioneered the outlet industry in 1981 when it opened the country’s first authentic outlet shopping center in Burlington, NC.
[ad#Google Adsense 336×280-IA]There are now hundreds of outlet centers worldwide, owned by Tanger and others.
In 1993 Tanger became the first outlet center developer to be listed on the New York Stock Exchange as a publicly traded REIT.
Tanger’s portfolio of outlet center properties includes 44 outlet centers in 22 states coast-to-coast and in Canada.
Tanger centers welcome more than 185 million brand name bargain hunters annually.
Dividend Safety
I like to kick off these valuation articles by taking a look at the company’s dividend safety. I only want to spend time on companies whose dividends are safe.
For a more complete discussion of dividend safety and reliability, see Dividend Growth Investing Lesson 17: Dividend Safety.
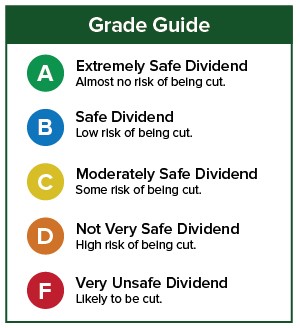
I use two services to assess dividend safety. The first is Simply Safe Dividends. This service uses the following scale to score dividend safety:
 Here is how Simply Safe Dividends scores Tanger’s dividend:
 Simply Safe Dividends gives SKT 89 out of a possible 100 points for dividend safety. Under their system, Tanger’s dividend is very safe and a cut is extremely unlikely.
The second service I use is Safety Net Pro. They use the following scale to score dividend safety:
 Safety Net Pro also rates SKT’s dividend as safe:
 At the time I put Tanger into the “ETF,” the stock was well valued. Let’s see if it still is.
Valuation Steps
For a complete discussion of how I value stocks, please consult Dividend Growth Investing Lesson 11: Valuation. I employ 4 valuation methods and then average them out to get an overall picture.
Step 1: FASTGraphs Default Valuation
In the the first step, we check the stock’s current price against FASTGraphs’ basic estimate of its fair value.
When valuing a REIT, normal earnings are not used, because REIT operations are different from traditional companies. REITs purchase properties based on estimated cash flows over long periods rather than on earnings or historical book values. When I value REITs, I use the industry standard for profits, which is called funds from operations (FFO).
FFO is a measure of earnings tht can be requested on FASTGraphs. As when using regular earnings, we first compare the REIT’s actual price-to-FFO (P/FFO) ratio to a reference that represents historical averages for the market, which is 15.
That fair-value reference is shown by the orange line on the following graph. You can see that the data dots on the orange line are labelled “F,” which indicates that they represent FFO. The black line is SKT’s actual price.
 The black price line is below the orange fair-price line. So this first step suggests that Tanger is a little undervalued.
How much is the undervaluation? We answer that by comparing the stock’s actual P/FFO ratio of 13.6 (shown at the upper right) to the reference ratio of 15 used to draw the orange line.
We get 13.6 / 15 = 0.91. Converting that to 91%, it suggests that SKT is trading at a discount of 9% to its fair value, as computed by this first method of valuation.
I call anything within +/- 10% of fair value “fair.” Valuation is an appraisal process, so I don’t want to suggest false precision by cutting things too fine.
We can calculate Tanger’s fair price by dividing its current price by the ratio 0.91. That’s $32.44 / 0.91 or about $36. Again, I round fair-value estimates off to the nearest dollar to avoid creating a false sense of precision.
Step 2: FASTGraphs Normalized Valuation
In the second step, we compare Tanger’s current P/FFO ratio to its own long-term average P/FFO ratio. So in this step, instead of judging fair valuation by how the market has valued all stocks over many years, we judge it by how the market has historically valued SKT itself.
 Using a 10-year look-back period, Tanger appears more undervalued than before, because the market has valued SKT at an averge P/FFO ratio of 17.0 rather than the 15 used in the first step. (See the historical P/FFO ratio in the dark blue panel at the right.)
How much is SKT undervalued compared to its historical norm? We use the same equation as before: 13.6 / 17.0 = 0.80, or 80%. This suggests that Tanger is undervalued by 20%.
The fair price using this valuation method is $41.
Step 3: Morningstar Star Rating
The next step is to see what Morningstar has to say.
Morningstar takes a different approach to valuation. They ignore P/E or P/FFO ratios. Instead, they use a discounted cash flow (DCF) model. They discount all of the stock’s projected future cash flows back to the present to arrive at a fair value estimate. (If you would like to learn more about how DCF works, check out this excellent explanation at moneychimp.)
When this technique is done right, many investors consider it to be the best way to value a stock. Here is what Morningstar thinks about Tanger’s valuation:
![]() Morningstar gives SKT 4 stars on a 5-star scale. So they also believe that Tanger is undervalued.
Morningstar gives SKT 4 stars on a 5-star scale. So they also believe that Tanger is undervalued.
Morningstar has computed a fair price of $37. Tanger’s current price is about 12% under that.
Step 4: Current Yield vs. Historical Yield
Finally, as a 4th valuation method, we compare the stock’s current yield to its historical yield. If a stock is yielding more than its historical average, that suggests that it is a better value than usual.
Tanger’s current yield is 4.0%. According to Morningstar, its 5-year average yield is 2.9%. Thus under this method, Tanger is again undervalued. The ratio of its current yield to its 5-year average yield is 1.9.
To be conservtive when I use this method, I cut off the maximum ratio at 1.2, because this is the most indirect method of assessing valuation.
Tanger’s fair price at 20% undervaluation is $41.
Valuation Summary
Using the 4 approaches just described, our valuation for Tanger Factory Outlets looks like this.
 The average of the 4 fair-value prices is $39 compared to SKT’s actual price of about $32. That’s an 18% difference. In my book, Tanger is Undervalued. If you like everything else about the company, now would not be a bad time to buy it.
Tanger Factory Outlets is a Dividend Contender, and it just added a year to its now-24-year streak of consecutive dividend increases. It just announced its annual dividend increase for 2017. The increase is 5.4%, payable in May. The ex-dividend date is April 26.
Caution
As always, this is not a recommendation to buy Tanger Factory Outlets. Please perform your own due diligence. This article covered only the stock’s valuation and dividend safety ratings, noot anything else about it. Check out the company’s quality, financial position, business model, and prospects for the future. Also consider whether it fits (or does not fit) the long-term investing goals that you have for your portfolio.
Note on Last Month’s Valuation-Zone Stock
Last month’s valuation stock, Williams-Sonoma (WSM), was just weeks away from announcing its 2017 dividend increase at the time of publication. The increase has since been declared as 5.4% for 2017. The ex-dividend date for that payment is April 26 and the payment date is May 26, 2017.
— Dave Van Knapp
[ad#wyatt-income]