
Williams-Sonoma (WSM), the purveyor of products for cooking, dining, and entertaining, is a stock that I included in my Dividend Growth “ETF” portfolio at Motif Investing, which I launched at the beginning of this year.
Williams-Sonoma took me by surprise when I was researching stocks for that portfolio. The company had not previously been on my dividend growth radar screen.
[ad#Google Adsense 336×280-IA]But it checked out in all respects, made it through all the screens and scoring challenges, and ended up in the portfolio.
Its price has dropped a couple of percent since then, so it may be even a better value now than when I bought the “ETF” portfolio.
Dividend Safety
I always kick off these valuation articles by taking a look at the company’s dividend safety.
I only want to spend time on companies whose dividends are safe.
For a more complete discussion of dividend safety and reliability, see Dividend Growth Investing Lesson 17: Dividend Safety.
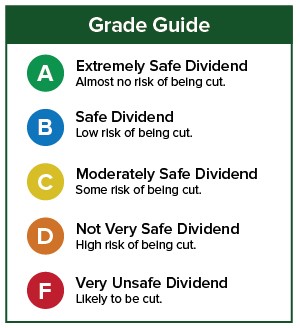
I use two services to assess dividend safety. The first is Simply Safe Dividends. This service uses the following scale to score dividend safety:
 Here is how Simply Safe Dividends scores Williams-Sonoma:
 As you can see, Simply Safe Dividends gives WSM 95 out of a possible 100 points for dividend safety, suggesting that the dividend is very safe and that a dividend cut is extremely unlikely.
The second service I use is Safety Net Pro. They use the following scale to score dividend safety:
 Safety Net Pro also rates WSM’s dividend as safe:
 So let’s go through our valuation steps and see how Williams-Sonoma stacks up.
Valuation Steps
For a complete discussion of how I value stocks, please consult Dividend Growth Investing Lesson 11: Valuation. I employ 4 methods and then average them out.
Step 1: FASTGraphs Default Valuation
In the the first step, we check the stock’s current price against FASTGraphs’ basic estimate of its fair value.
In this step, we compare the stock’s actual price-to-earnings (P/E) ratio to the historical average P/E ratio of the whole stock market, which is 15. That fair-value reference is shown by the orange line on the following graph, while the black line is WSM’s actual price.
 The black price line is just a little below the orange fair-price line. So this first step suggests that Willims-Sonoma is slightly undervalued.
How much is the undervaluation? We answer that by comparing the stock’s actual P/E ratio of 14.1 (shown at the upper right) to the ratio of 15 that was used to draw the orange line.
We get 14.1 / 15 = 0.94. Converting that to 94%, WSM is trading at a discount of 6% to its fair value, as computed by this first method of valuation.
I call anything within +/- 10% of fair value “fair.”
We can calculate WSM’s fair price by dividing its current price by the ratio 0.94. That’s $48.28 / 0.94 or about $51. I round fair-value estimates off to the nearest dollar to avoid creating a false sense of precision. Valuations are estimates, not scientific calculations.
Step 2: FASTGraphs Normalized Valuation
In the second step, we compare Williams-Sonoma’s current P/E ratio to its own long-term average P/E ratio. In other words, instead of judging fair valuation by how the market has valued all stocks over many years, we judge it by how the market has historically valued WSM itself.
 When we do this, WSM looks more undervalued than before. That’s because over the past 10 years, the market has valued WSM at an averge P/E ratio of 18 rather than the 15 used in the first step. The price at the valuation of 18 is shown in dark blue.
As you can see, WSM’s actual price falls quite a bit below the blue fair-value reference line.
How much? We use the same equation as before: 14.1 / 18.0 = 0.78, or 78%. So this suggests that Williams-Sonoma is 22% undervalued.
The fair price using this valuation method is $62.
Step 3: Morningstar Star Rating
The next step is to see what Morningstar has to say.
Morningstar takes a different approach to valuation. They ignore P/E ratios. Instead, they use a discounted cash flow (DCF) model. They discount all of the stock’s projected future cash flows back to the present to arrive at a fair value estimate. (If you would like to learn more about how this works, check out this excellent explanation at moneychimp.)
When this technique is done right, many investors consider it to be the finest way to value a stock. Here is what Morningstar thinks about Williams-Sonoma’s valuation:
![]() Morningstar gives WSM 5 stars on a 5-star scale. In other words, they believe that WSM is way undervalued. They have computed a fair price of $73, which is a gap of 34% from the actual price.
Morningstar gives WSM 5 stars on a 5-star scale. In other words, they believe that WSM is way undervalued. They have computed a fair price of $73, which is a gap of 34% from the actual price.
Step 4: Current Yield vs. Historical Yield
Finally, as a 4th valuation method, we compare the stock’s current yield to its historical yield. If a stock is yielding more than its historical average, that suggests that it is a better value than usual.
[ad#Google Adsense 336×280-IA]Williams-Sonoma’s current yield is 3.1%.
According to Morningstar, its 5-year average yield is 2.2%.
Thus under this method, WSM is undervalued.
The ratio of its current yield to its 5-year average yield is 1.41.
When I use this method, I cut off the maximum ratio at 1.2, because this is a rather indirect method of assessing valuation, and I want to be conservative.
WSM’s fair price at 20% undervaluation is $58.
Valuation Summary
Using the 4 approaches just described, our valuation for Williams-Sonoma comes out like this.
 The average of the 4 fair-value prices is $61 compared to WSM’s actual price of abput $48. That’s a 21% difference. In my book, that is Far Undervalued.
Williams-Sonoma is a Dividend Contender, with an 11-year streak of consecutive dividend increases. Last year, it announced its annual dividend increase around the middle of March, payable in May. That increase was 5.7%.
So it is likely that we are just a week or two away from WSM announcing this year’s dividend increase.
Caution
As always, this is not a recommendation to buy Williams-Sonoma. Always perform your own due diligence. Check out the company’s quality, financial position, business model, and prospects for the future. Also consider whether it fits (or does not fit) into your portfolio in terms of diversification and your long-term investing goals.
— Dave Van Knapp
[ad#agora]